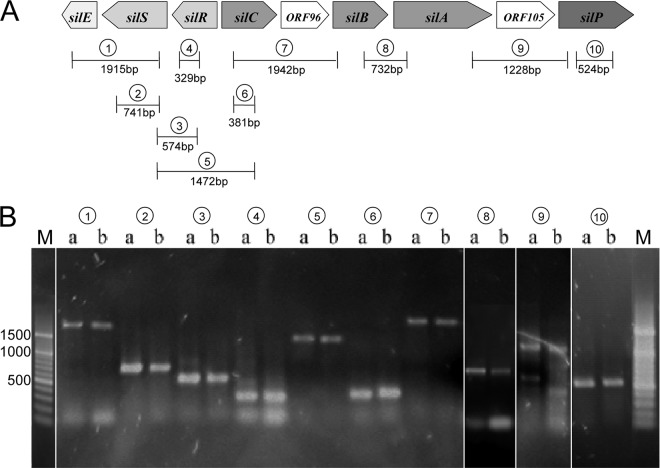
Fig 2.
The sil operon in Enterobacter cloacae. (A) Graphic illustration of the sil operon with marked PCR amplification sites. (B) PCRs of the sil operon; Lanes a, positive control DH5α pMG101; lanes b, tester strain EN-373. Lane pairs: 1, silE to silS; 2, silS; 3, silS to silR; 4, silR; 5, silS to silC; 6, silC; 7, silC to silB; 8, silB to silA; 9, silA to silP; 10, silP. M, 100-bp DNA marker.

