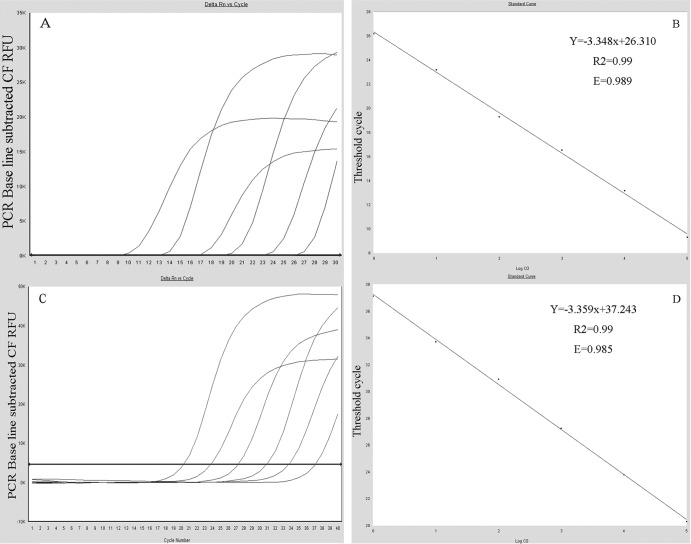
Fig 2.
Standard curve and amplification curves. Standard curves (based on plasmid DNA) indicating the linearity and efficiency of the reactions are shown. The results of serial 10-fold dilutions of standard DHAV-C (A) and GAPDH (C) from 3.36 × 10³ to 3.36 × 10⁸ gene copies per reaction and 8.32 × 10² to 8.32 × 10⁷ gene copies per reaction were determined by real-time PCR, respectively. Linearity of two assays of DHAV-C (B) and GAPDH (D) spanned 6 orders of magnitude. The slope of the curve (logarithmic dilution versus threshold cycle) and the intercept are given in the equation in the figure. In the linear equation, the X represents the log of the starting quantity and the Y represents the threshold cycle. R2, correlation coefficient; E, efficiency.

