
Fig 1.
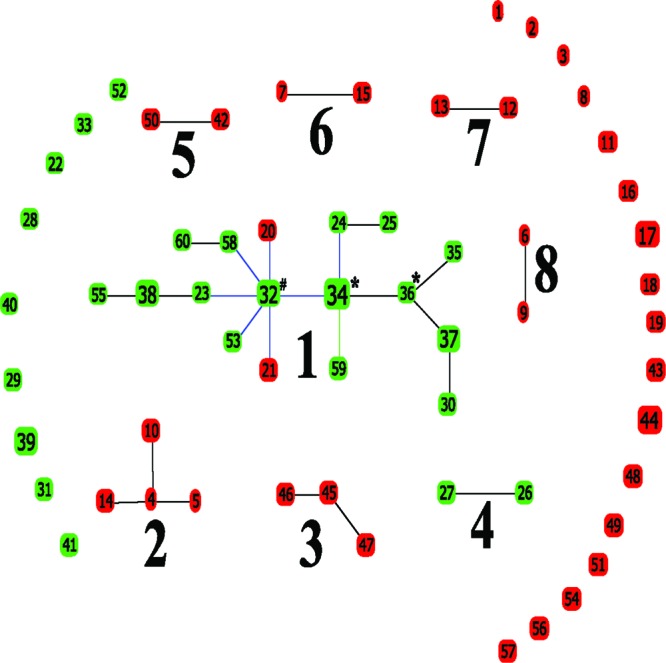
goeBURST analysis of 68 isolates representing 60 STs. goeBURST analysis revealed eight clonal complexes and 26 singleton STs within the sample population. Green ST nodes clustered to clade A in the neighbor-joining phylogram (NJ); red ST nodes clustered to clade B in the NJ phylogram. Large, bold numbers identify CCs, small numbers indicate ST nodes. Symbols: #, group founder; *, subgroup founder. Colored links: black, link drawn without recourse to tiebreak rules; blue, link drawn using tiebreak rule 1; and green, link drawn using tiebreak rule 2 (24).