Fig 3.
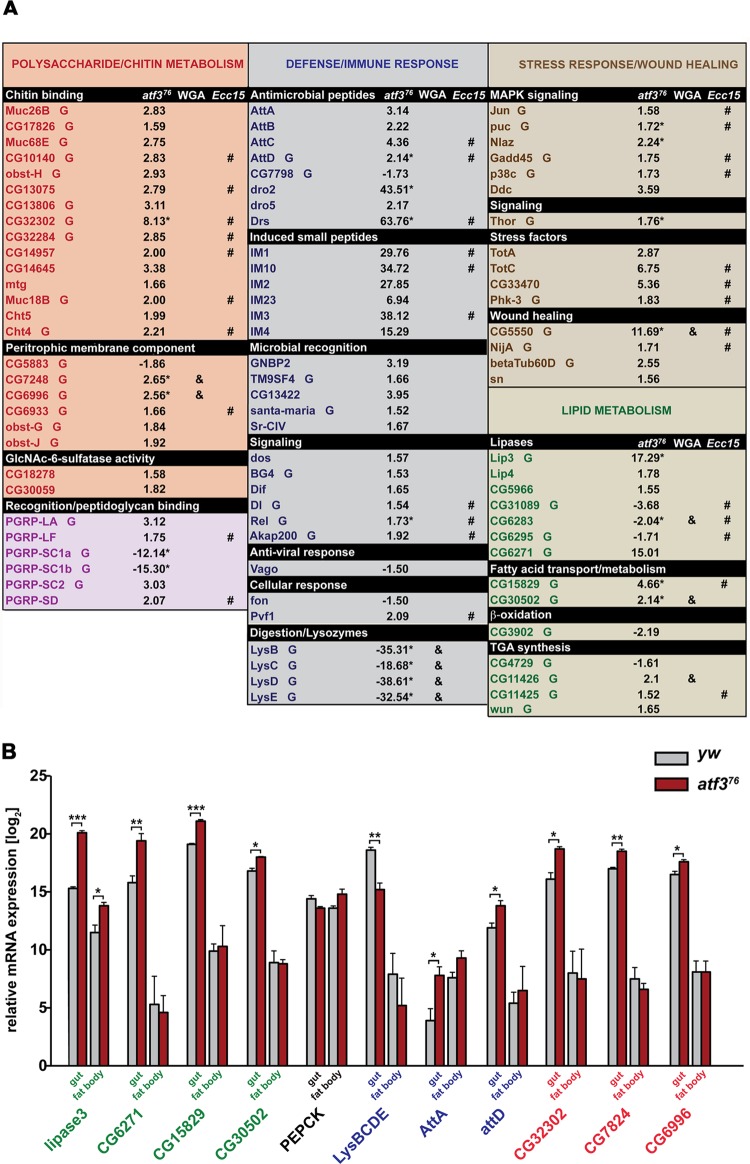
Genome activity in atf3 mutants reveals signs of gut damage associated with elevated immune, stress, and starvation responses. (A) Genes affected by loss of atf3 are clustered by functional GO terms (top row) or selected based on annotated function in lipid metabolism. The numbers represent the fold change of gene expression in atf376 mutants relative to the control. mRNAs enriched in the larval gut based on FlyMine and our data (Fig. 3B) are marked “G.” Genes affected in the same sense either by Ecc15 (8) or WGA (36) ingestion are highlighted (# and &, respectively). The asterisks indicate genes whose expression was validated by qRT-PCR on independent RNA samples. Genes assigned to recognition/peptidoglycan binding belong to the polysaccharide/chitin and immune defense clusters. (B) Relative expression levels of selected transcripts were compared, using qRT-PCR, between gut and fat body tissues isolated from third-instar control (yw) and atf376 larvae. Gene names appear in color according to functional categories shown in panel A: the polysaccharide/chitin metabolism cluster (red), the defense/immune response cluster (blue), and genes for lipid metabolism (green). Basal mRNA levels of lipase genes (lip3 and CG6271) and genes involved in fatty acid metabolism (CG15829 and CG30502) were higher in the gut than in the fat body, and loss of atf3 had a more pronounced effect on their upregulation in the gut; lip3 mRNA increased in both organs, but more so in the gut. Note that the y scale is logarithmic. Transcription of PEPCK was not significantly altered by atf3 deficiency in either tissue. Note the elevated basal expression of attA mRNA in the fat body and its upregulation upon atf3 loss specifically in the gut. In agreement with the FlyAtlas data, the gut shows enrichment for transcripts of polysaccharide/chitin metabolism (CG32302, CG7824, and CG6996), whose expression is further enhanced in the atf3-deficient gut. The data are means and SEM; n = 4; *, P < 0.05; **, P < 0.01; and ***, P < 0.001.

