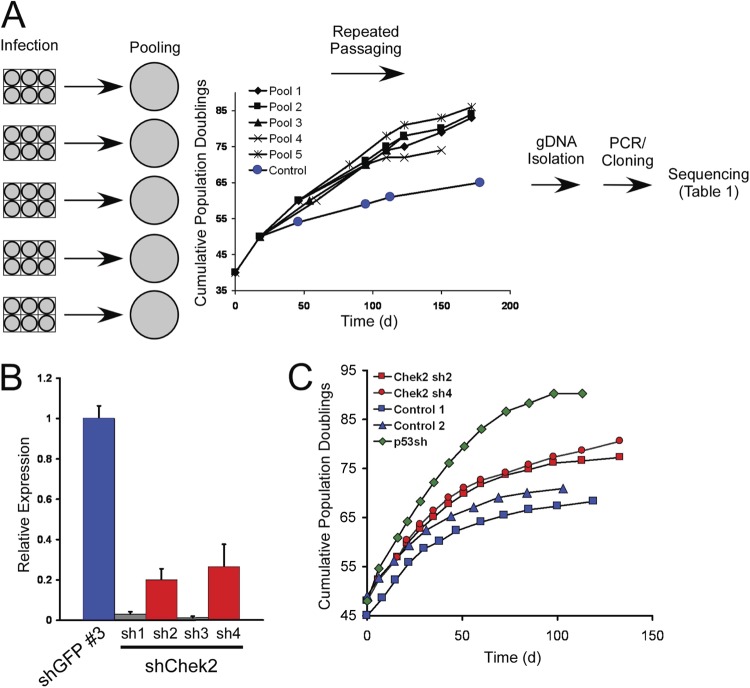
Fig 1.
Pooled shRNA screen to identify genes affecting senescence. (A) Flow chart of the experimental design used in the study. BJ cells were infected with individual pools of shRNAs and passaged when nearly confluent until control cultures had entered replicative senescence. The graph shows the cumulative population doublings of the pools during the course of the experiment. DNA was isolated from these six pools at the final time point, and shRNAs were amplified by PCR, cloned, and sequenced to determine the identities of individual shRNAs in each pool. gDNA, genomic DNA. (B) Suppression of CHEK2 expression. One control shRNA (shGFP no. 3) and four shRNAs targeting CHEK2 (sh1 to sh4) were introduced into BJ cells at PD 45, and knockdown was measured by qRT-PCR. The error bars represent standard deviations (SD) from triplicate experiments. (C) Proliferation of cells upon suppression of CHEK2. Cells expressing two shRNAs that suppress CHEK2 (red data points, corresponding to the red bars in panel B) were grown in serial passages, together with cells expressing an shRNA targeting p53 (green data points) and two control cell lines expressing shGFP (blue data points). On the indicated days, the number of PD achieved by each culture was measured.

