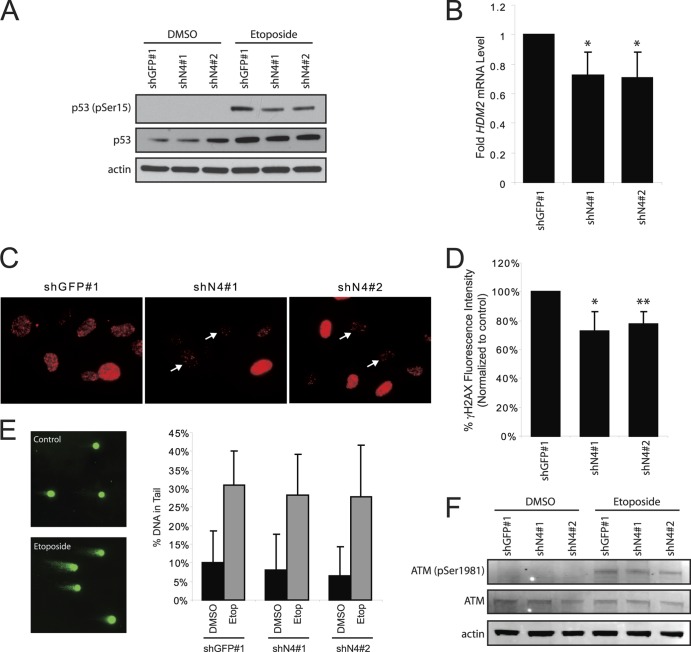
Fig 11.
Effect of NEK4 suppression on events downstream of DNA-PK. (A) Immunoblotting of phosphoserine 15 (pSer15) p53, total p53, and actin (loading control) in BJ shGFP no. 1, BJ shN4 no. 1, and BJ shN4 no. 2 cells treated with vehicle control or 50 μM etoposide. (B) qRT-PCR analysis of HDM2 mRNA levels in BJ shGFP no. 1 and BJ shN4 no. 1 and no. 2 cells treated with 50 μM etoposide. *, P < 0.045 compared to shGFP control. The fold change is shown. The error bars indicate SD. (C) Immunofluorescence staining of γ-H2AX foci in BJ shGFP no. 1 or BJ shN4 no. 1 and no. 2 fibroblasts following 50 μM etoposide treatment. The arrows indicate cells that display reduced γ-H2AX levels compared to control shGFP no. 1 cells. (D) Flow cytometric analysis of γ-H2AX levels. The bars indicate the percentages of γ-H2AX fluorescence levels in etoposide-treated BJ shGFP no. 1 or BJ shN4 no. 1 and no. 2 cells normalized to DMSO-treated cells. *, P < 0.03, and **, P < 0.009 compared to shGFP control. (E) Comet assay to assess the amount of DNA damage acquired. (Left) Fluorescence images of representative control and etoposide-treated cells after electrophoresis. (Right) The bars indicate the percentages of DNA found in the comet tail of DMSO or etoposide-treated BJ shGFP no. 1 and BJ shN4 no. 1 and no. 2 cells. At least 100 cells were analyzed per condition for each triplicate experiment. (F) Immunoblot analysis of ATM activation. Whole-cell lysates from DMSO- or etoposide-treated BJ shGFP no. 1 and BJ shN4 no. 1 and no. 2 cells were separated by SDS-PAGE and immunoblotted to examine levels of phosphoserine 1981 (pSer1981) ATM, total ATM, and actin as a loading control.

