Fig 2.
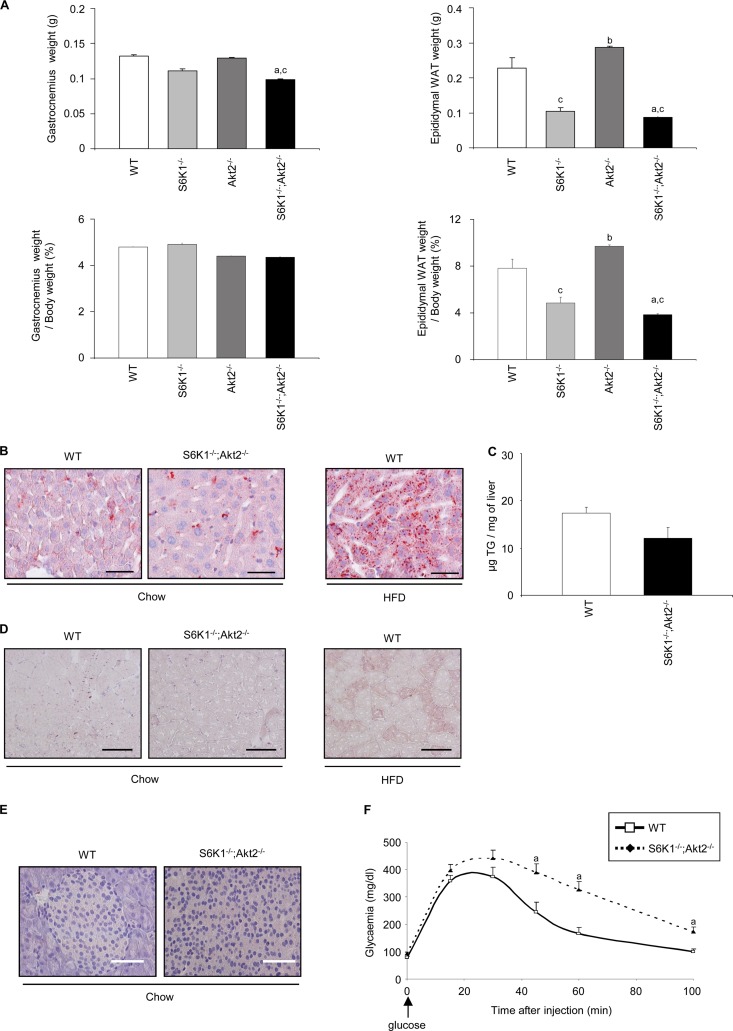
Reduced adiposity in S6K1−/− Akt2−/− mice. (A) Absolute weights (top) and weights normalized over body weight (bottom) of gastrocnemius and epididymal adipose tissues of 6-month-old mice of the indicated genotypes starved for 6 h (n ≥ 5). (B) Oil red O staining of frozen liver sections from wild-type or S6K1−/− Akt2−/− mice starved for 6 h (scale bars, 50 μm). Liver sections from mice fed a high-fat diet for 16 weeks were used as positive controls. (C) Triglyceride concentration in liver tissue of wild-type or S6K1−/− Akt2−/− mice starved for 6 h (n ≥ 6). (D) Oil red O staining of frozen gastrocnemius sections from wild-type or S6K1−/− Akt2−/− mice starved for 6 h. Gastrocnemius sections from mice fed a high-fat diet for 16 weeks were used as positive controls (scale bars, 100 μm). (E) Oil red O staining of frozen pancreas sections from wild-type or S6K1−/− Akt2−/− mice starved for 6 h (scale bars, 50 μm). (F) Glucose tolerance test after intraperitoneal injection of glucose indexed over lean mass in 6-month-old mice of the indicated genotypes (n ≥ 7). All values are expressed as means and SEM. a, P < 0.05 versus the wild-type group; b, P < 0.05 versus the S6K1−/− group; c, P < 0.05 versus the Akt2−/− group.

