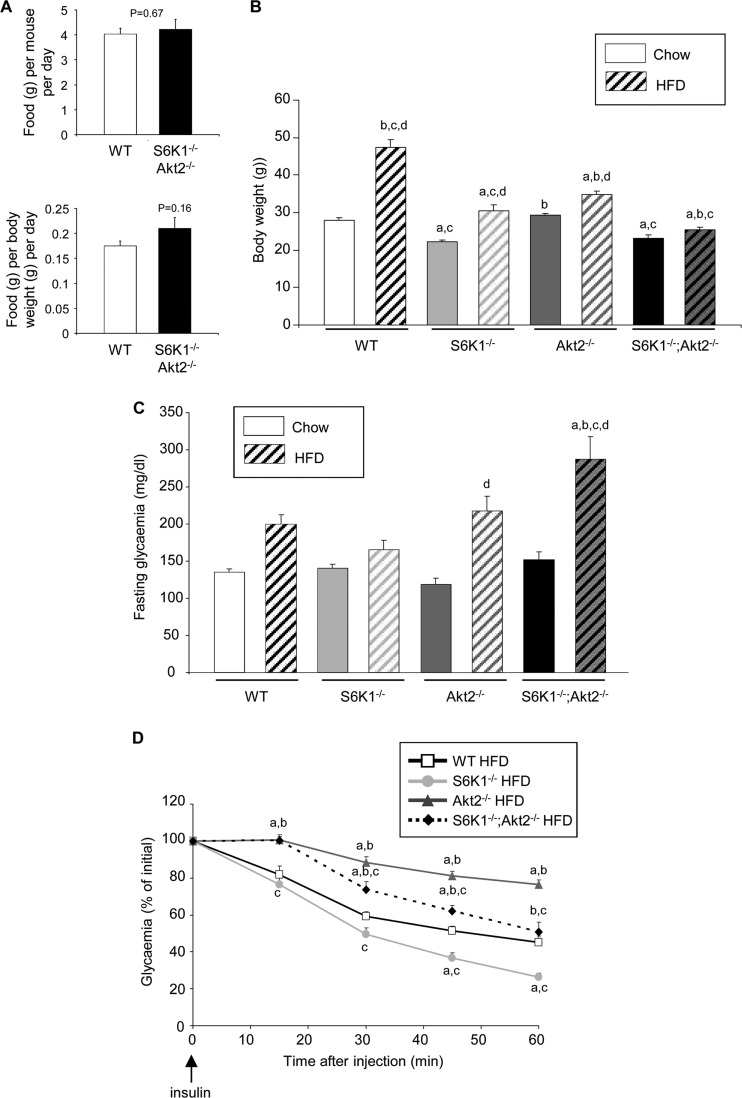
Fig 6.
Interaction of S6K1 and Akt2 in the control of weight gain and glycemia after a high-fat diet. (A) Food intake per mouse of the indicated genotypes on an HFD measured over 15 days or normalized by body weight (n = 6). (B) Body weights of 6-month-old mice of the indicated genotypes fed a chow diet or an HFD for 16 weeks (n ≥ 11). (C) Glucose levels after a 3-h fast in 5-month-old mice of the indicated genotypes fed a chow diet or an HFD for 12 weeks (n ≥ 6). (D) Insulin tolerance test after intraperitoneal injection of insulin in 5-month-old mice of the indicated genotypes fed a chow diet or an HFD for 12 weeks (n ≥ 6). All values are expressed as means and SEM. a, P < 0.05 versus the wild-type group; b, P < 0.05 versus the S6K1−/− group; c, P < 0.05 versus the Akt2−/− group; d, P < 0.05 versus the chow-fed group.

