Fig 7.
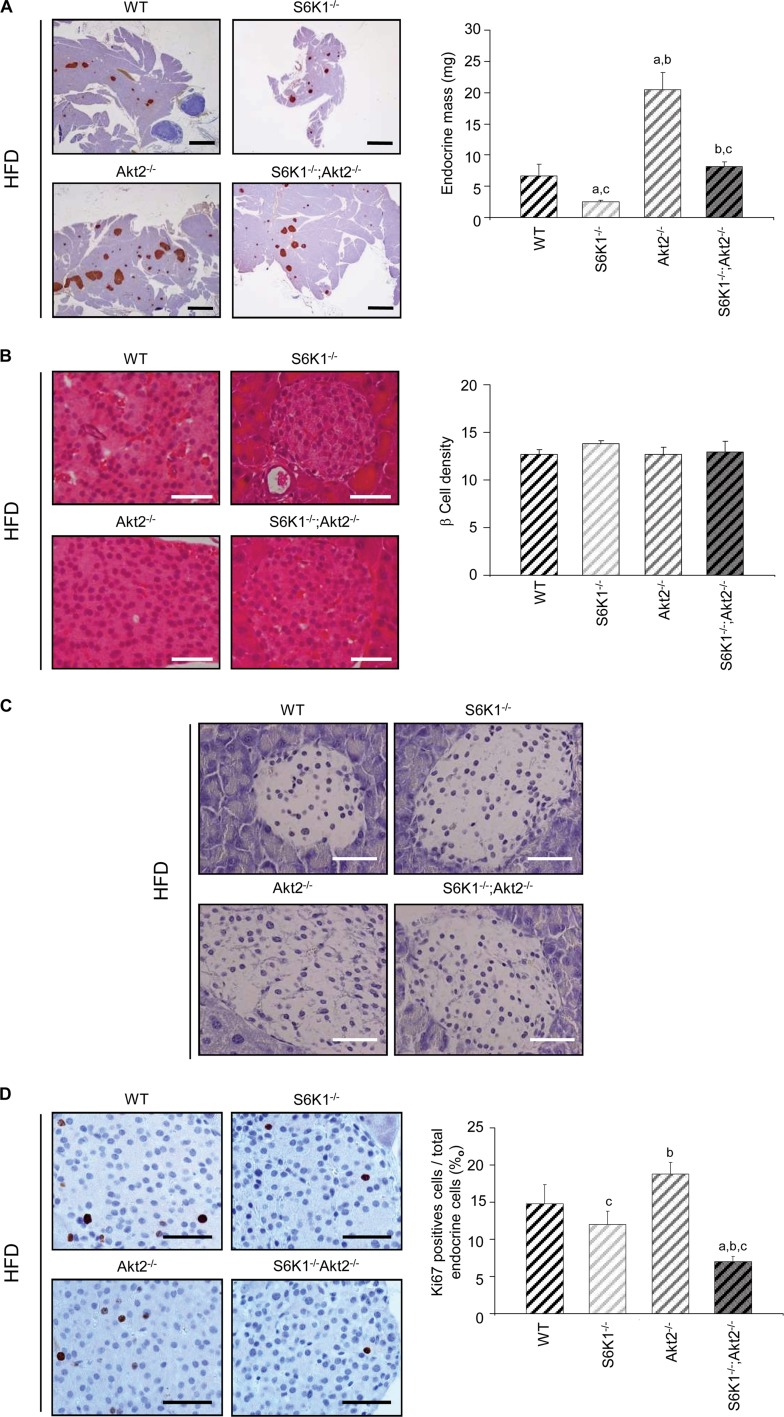
S6K1−/− Akt2−/− mice show defects in β-cell proliferation induced by HFD. (A) Histological analysis of pancreatic sections of 6-month-old mice of the indicated genotypes fed an HFD for 16 weeks and starved for 6 h. The sections were immunostained for insulin and counterstained with hematoxylin. Shown are representative islets (left) (scale bars, 1,000 μm) and quantification of the endocrine mass (n ≥ 5) (right). (B) Histological analysis of pancreatic sections from 6-month-old mice of the indicated genotypes fed an HFD for 16 weeks and starved for 6 h. The sections were stained with hematoxylin and eosin. Shown are representative islets (left) (scale bars, 50 μm) and quantification of β-cell density assessed by counting the nuclei in a 1,720-μm2 islet area (n ≥ 4) (right). (C) TUNEL staining in pancreas sections from 6-month-old mice of the indicated genotypes fed an HFD for 16 weeks and starved for 6 h. Scale bars, 50 μm. (D) Histological analysis of pancreatic sections from 6-month-old mice of the indicated genotypes fed an HFD for 16 weeks and starved for 6 h. The sections were immunostained for Ki67 and counterstained with hematoxylin. Shown are representative islets (left) (scale bar, 50 μm) and quantification of Ki67-positive cells over total endocrine cells (n ≥ 7) (right). All values are expressed as means and SEM. a, P < 0.05 versus the wild-type group; b, P < 0.05 versus the S6K1−/− group; c, P < 0.05 versus the Akt2−/− group.

