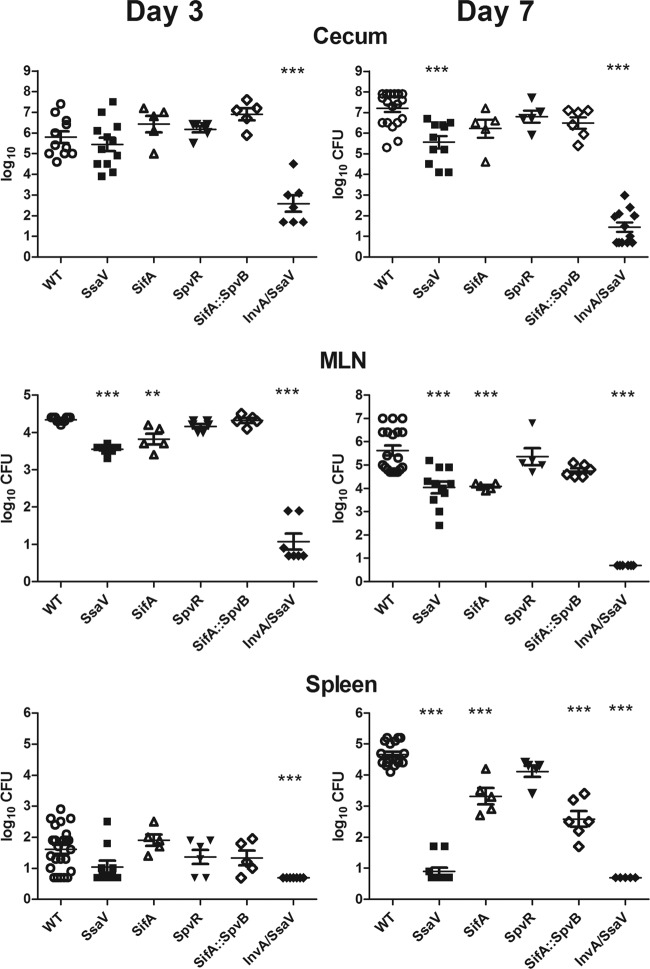
Fig 3.
Infectivity of WT and mutant Salmonella 3 and 7 days after infection. The numbers of CFU in the tissues were determined as described in Materials and Methods. Each symbol represents 1 mouse, and the horizontal lines show the geometric mean ± 1 SEM. Each mutant was compared to the WT (**, P < 0.01; ***, P < 0.001; ANOVA with Dunnett's posttest modification). MLN, mesenteric lymph nodes.

