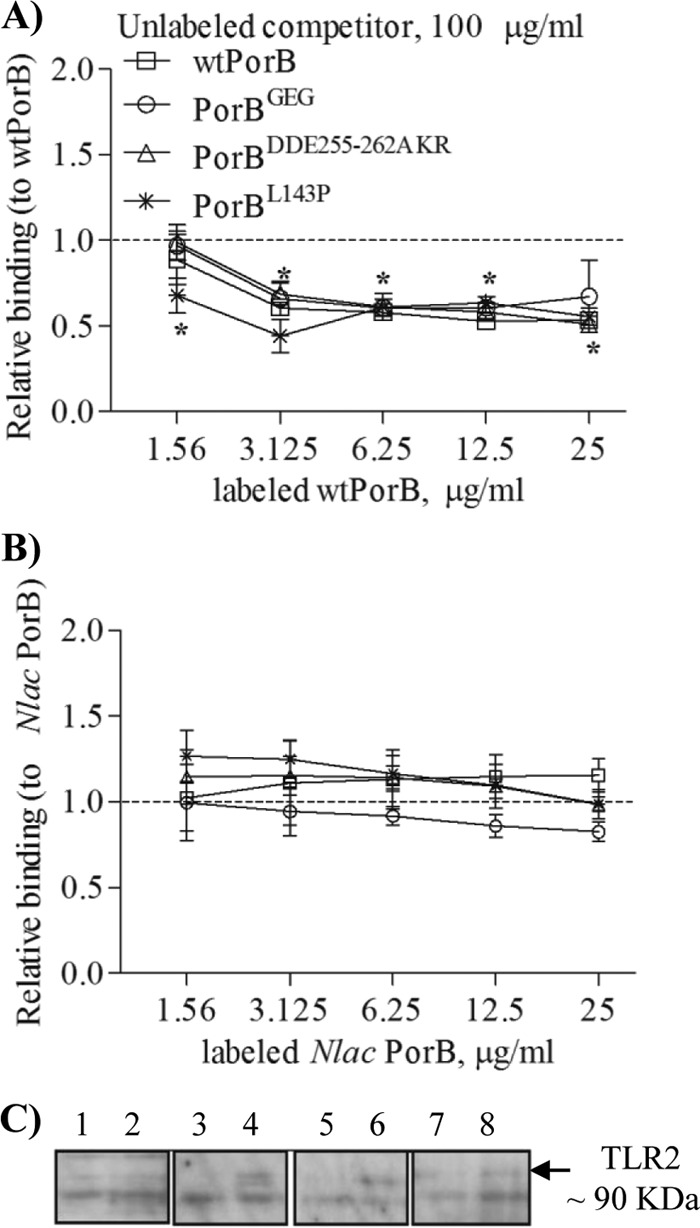
Fig 4.

Cell surface TLR2 binding. (A) Inhibition of dose-dependent binding of fluorescently labeled wtPorB to TLR2-HEK cells measured by flow cytometry using an excess (100 μg/ml) of unlabeled wtPorB, PorBGEG, PorBDDE25-262AKR, and PorBL143P. (B) Inhibition of fluorescently labeled N. lactamica PorB binding as described for panel A. Binding is expressed as mean fluorescence intensity (MFI) normalized to that of fluorescent PorB ± standard deviations. *, P = 0.05 by Wilcoxon signed rank test; n = 6. (C) TLR2 pulldown assay of HEK cell lysates examined by Western blotting with anti-TLR2 antibody. Lanes 1, 3, 5, and 7, pcDNA HEK cells. Lanes 2, 4, 6, and 8, TLR2-HEK cells. Lanes 1 and 2, medium alone; lanes 3 and 4, biotinylated PorBGEG; lanes 5 and 6, biotinylated PorBDDE25-262AKR; lanes 7 and 8, biotinylated PorBL143P. A band of approximately 90 kDa, corresponding to TLR2, was detected in lanes 4, 6, and 8.
