Fig 3.
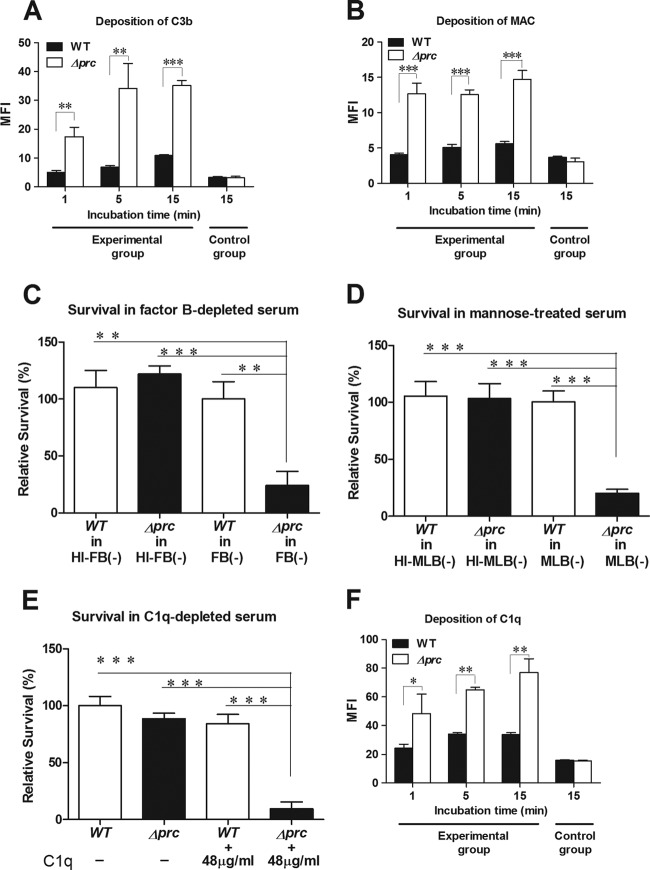
Interaction of WT-RS218 and Δprc-RS218 with complement components in human serum. (A, B, and F) Deposition of C3b (A), MAC (B), and C1q (F) on WT-RS218 and Δprc-RS218 in NHS. The levels of deposition were measured by flow cytometry after incubation of the bacteria in 40% NHS. The data are presented as the mean fluorescent intensity (MFI). The bacteria in the control group of the C3b deposition assay (A) were incubated in PBS instead of 40% NHS for 15 min and stained with the FITC-conjugated anti-C3 antibody. The bacteria in the control groups of MAC (B) and C1q (F) deposition assays were stained with the nonspecific isotypic antibodies of the corresponding primary antibodies after incubation in 40% NHS for 15 min. (C) Survival of E. coli strains after 15 min of incubation in 60% factor B-depleted human serum [FB(−)] or heat-inactivated factor B-depleted human serum [HI-FB(−)]. (D) Survival of the E. coli strains after 15 min of incubation in 60% mannose-treated NHS [MLB(−)] or heat-inactivated mannose-treated NHS [HI-MLB(−)]. (E) Survival of E. coli strains after 15 min of incubation in 60% C1q-depleted human serum with or without a supplement of 60% of the physiological concentration of purified C1q (the physiological concentration of C1q is about 80 μg/ml in NHS [18]). For panels C to E, the results are presented as relative survival rates compared to the survival rates of WT-RS218 in factor B-depleted serum, mannose-treated NHS, or C1q-depleted serum. For all of the results, the data shown are representative of three independent experiments performed in triplicate. The results are shown as the means ± standard deviations. *, P values of <0.05; **, P values of <0.01; ***, P values of <0.001.

