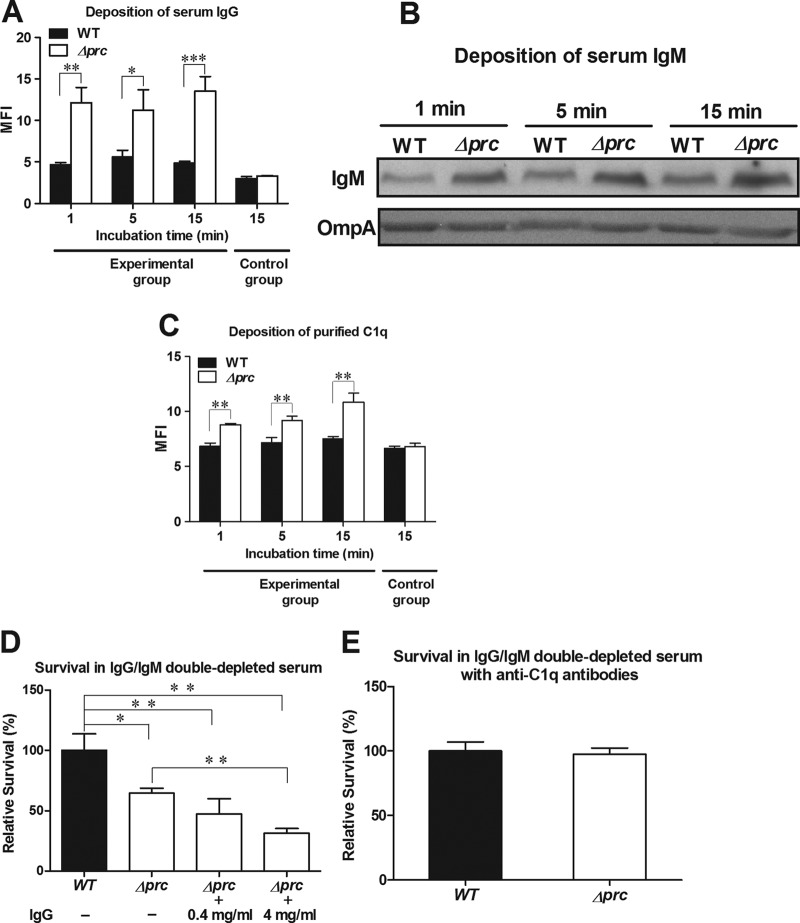
Fig 4.
Roles of IgG, IgM, and C1q in complement-mediated serum killing. (A) Deposition of serum IgG. The levels of IgG deposition were measured by flow cytometry after incubation of the bacteria in 40% NHS. The bacteria in the control group were stained with the nonspecific isotypic antibody of the corresponding primary antibody after incubation in 40% NHS for 15 min. (B) Deposition of serum IgM. The levels of IgM deposition were determined by Western blot assays of similar amounts of bacteria after incubation in 40% NHS. Because the deletion of prc did not affect the expression of the OmpA protein in E. coli (data not shown), OmpA served as a loading control for bacteria. The levels of OmpA were determined by Western blot analysis with rabbit OmpA antiserum. (C) Deposition of purified C1q. The levels of C1q deposition were measured by flow cytometry after incubation of the bacteria with purified C1q protein (25 μg/ml). The bacteria in the control group were stained with the nonspecific isotypic antibody of the corresponding primary antibody after incubation in 40% NHS for 15 min. For panels A and C, the data are presented as mean fluorescent intensities. (D) Survival of WT-RS218 and Δprc-RS218 after 15 min of incubation in 60% IgG/IgM double-depleted NHS with supplementation with different concentrations of purified IgG. A concentration of 4 mg/ml of IgG is about 60% of that in NHS (40). (E) Survival of WT-RS218 and Δprc-RS218 after 15 min of incubation in 60% IgG/IgM double-depleted NHS with supplementation with anti-C1q antibodies (10% heat-inactivated rabbit antiserum) to block direct C1q binding. For panels D and E, the data are presented as relative survival rates compared to the survival rates of WT-RS218. All of the data shown are representative of three independent experiments performed in triplicate. The results are shown as the means ± standard deviations. *, P values of <0.01; **, P values of <0.01; ***, P values of <0.001.

