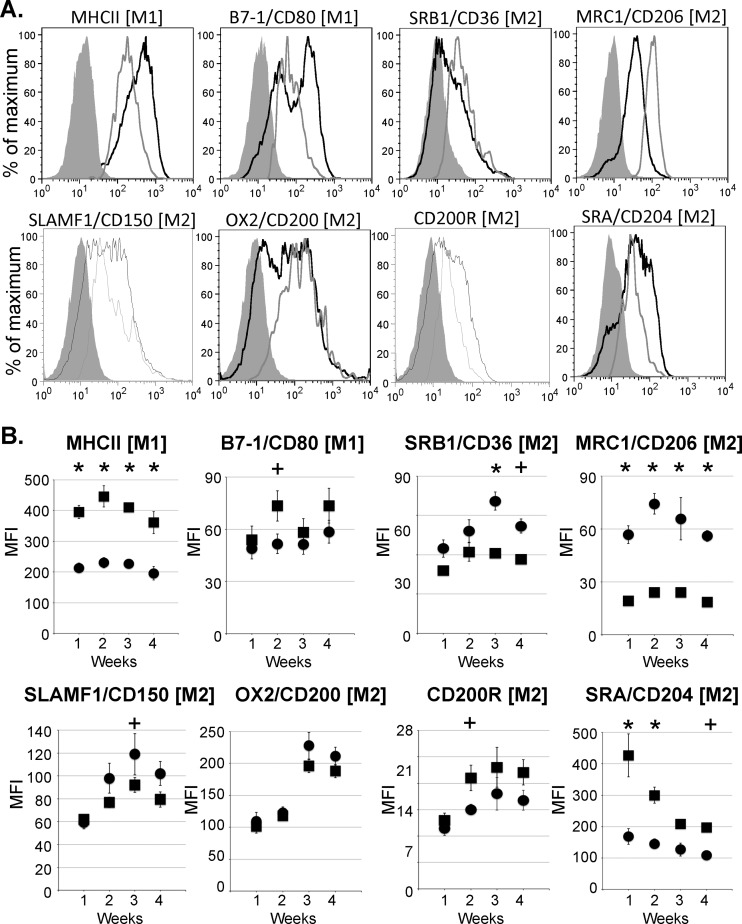
Fig 6.
Splenic hemophagocytic macrophages are distinct from 2-4N macrophages and express markers consistent with an M2 phenotype. (A) Histograms from representative mice of 2-4N (black line) and 6N+ (gray line) macrophages stained with the indicated marker and isotype controls (filled). (B) Means and SEM of MFI of 2-4N (square) and 6N+ (circle) macrophages. Data are from two experiments. n = from 11 to 12 mice at each week postinfection. *, P < 0.001; +, P < 0.05; each by Student's two-tailed t test.

