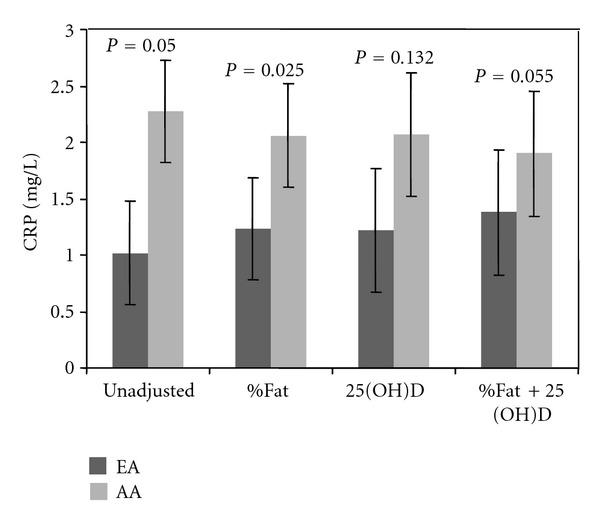
Figure 2.

Ethnic differences in hs-CRP (a) unadjusted, (b) adjusted for percent body fat, (c) adjusted for 25(OH)D, and (d) further adjusted for percent body fat and 25(OH)D. After adjusting for serum concentration of 25(OH)D, there was a 32% reduction in hs-CRP difference between AA and EA.
