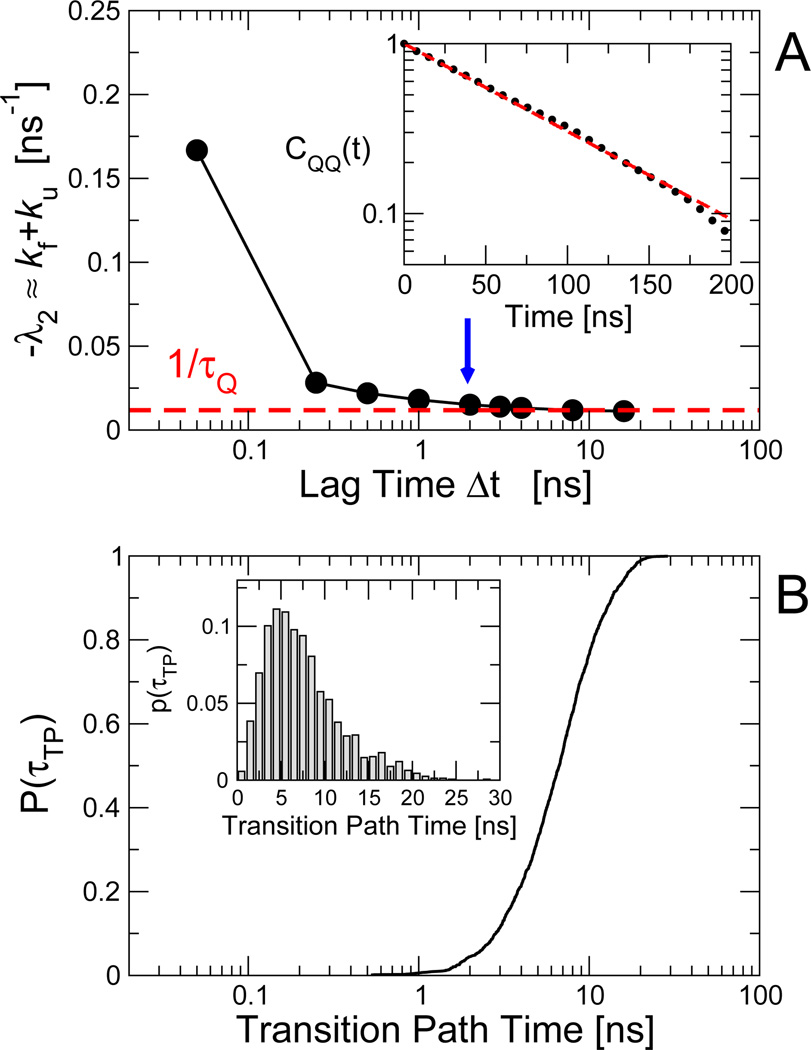
Fig. 2.
Construction of diffusive models. (A) Dependence of the slowest relaxation rate, given by the negative of the first non-zero eigenvalue λ2 of the diffusion operator, on the “lag time” Δt for the protein G Gō model. The inset shows the Q autocorrelation function CQQ(t), whose relaxation rate kQ is given by the broken red line in the main panel. For a lag time of 2 ns (blue arrow in (A), the resulting position-dependent free energies F(Q) and diffusion coefficients are shown in Fig. 3 A and B, respectively. (B) Cumulative distribution of transition path durations for protein G Gō model. The inset shows the corresponding probability density on a linear scale.

