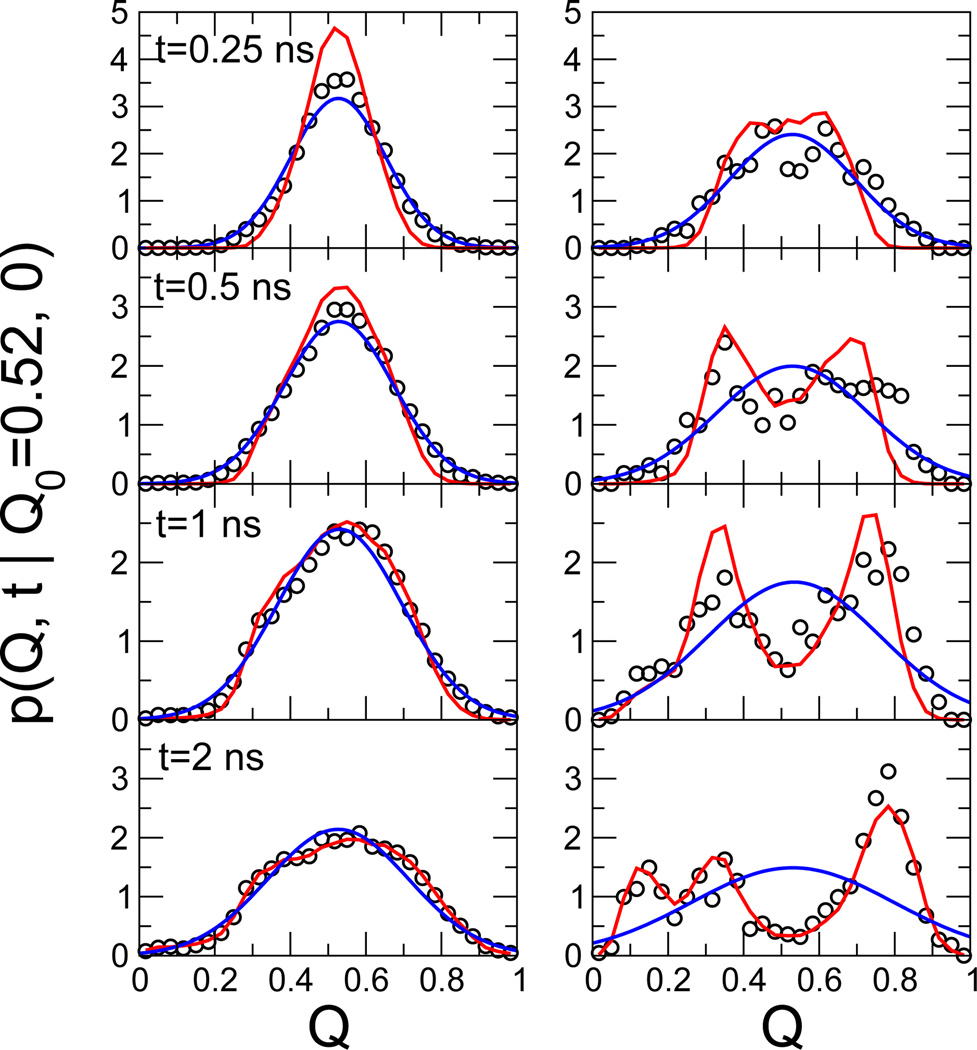
Fig. 4.
Dynamics at the top of the folding barrier. Propagators p(Q, t|Q0 = 0.52, 0) are shown for simulations (open circles) on the flat surface with V(Q) = −F(Q) added (left panels) and for the unperturbed system (right panels), collected at times t = 0.25, 0.5, 1, and 2 ns (top to bottom). Red lines are the predictions of the diffusion model, eqn (1), and blue lines are Gaussian fits based on the actual mean and variance.

