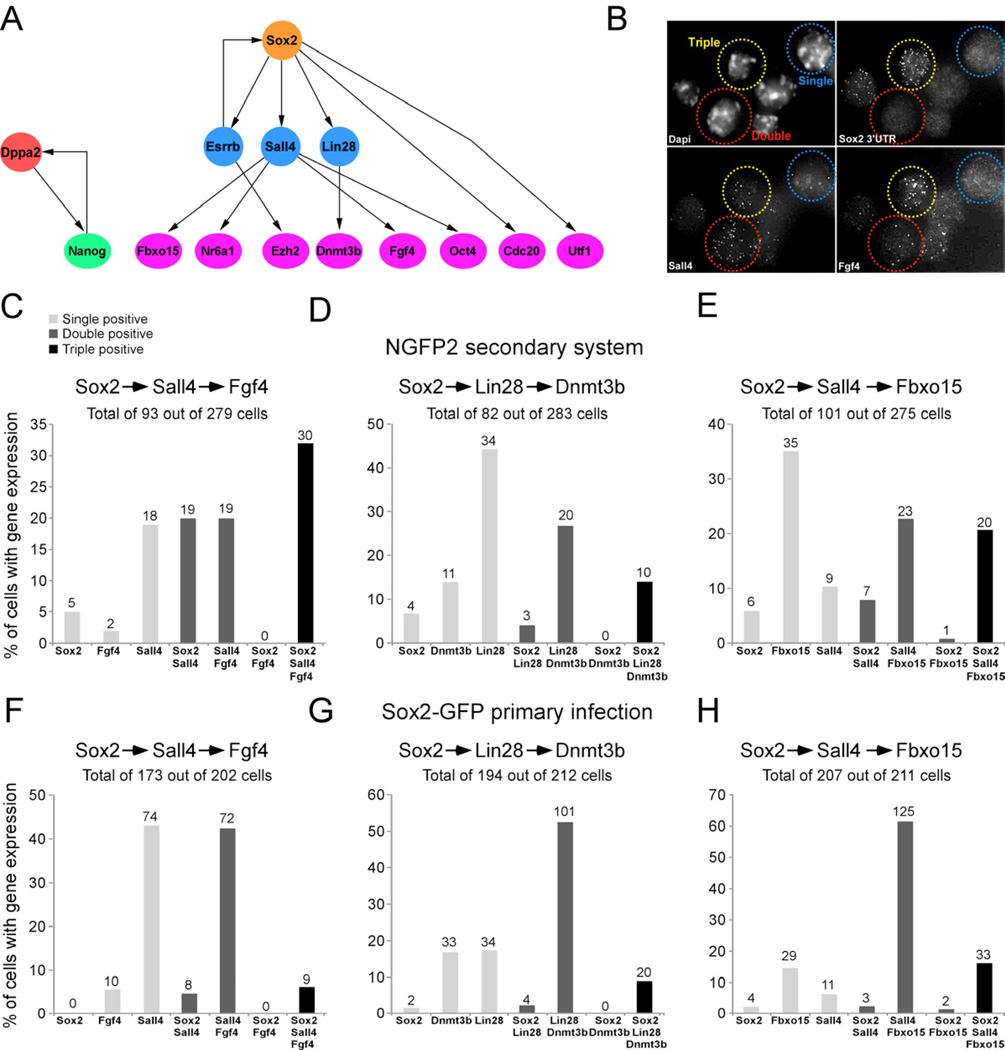
Figure 5. Model to predict the order of transcriptional events in single cells.
(A) Bayesian network to describe the hierarchy of transcriptional events among a subset of pluripotent genes. (B) sm-mRNA-FISH representative image of combination in Figure 5C showing a single positive cell (blue, Sall4), double positive cell (red, Sall4/Fgf4), and triple positive cell (yellow, Sox2/Sall4/Fgf4). (C–E) Bar plot of the percent of cells with transcripts, quantified by single molecule mRNA FISH, of single positive (light grey), double positive (dark grey), and triple positive (black) expression in single NGFP2 cells at day 12 on dox and in (F-H) single primary infected Sox2-GFP cells at day 12 on dox. The numbers of cells in each category is indicated on top of each bar. See also Figure S6 and Table S5.

