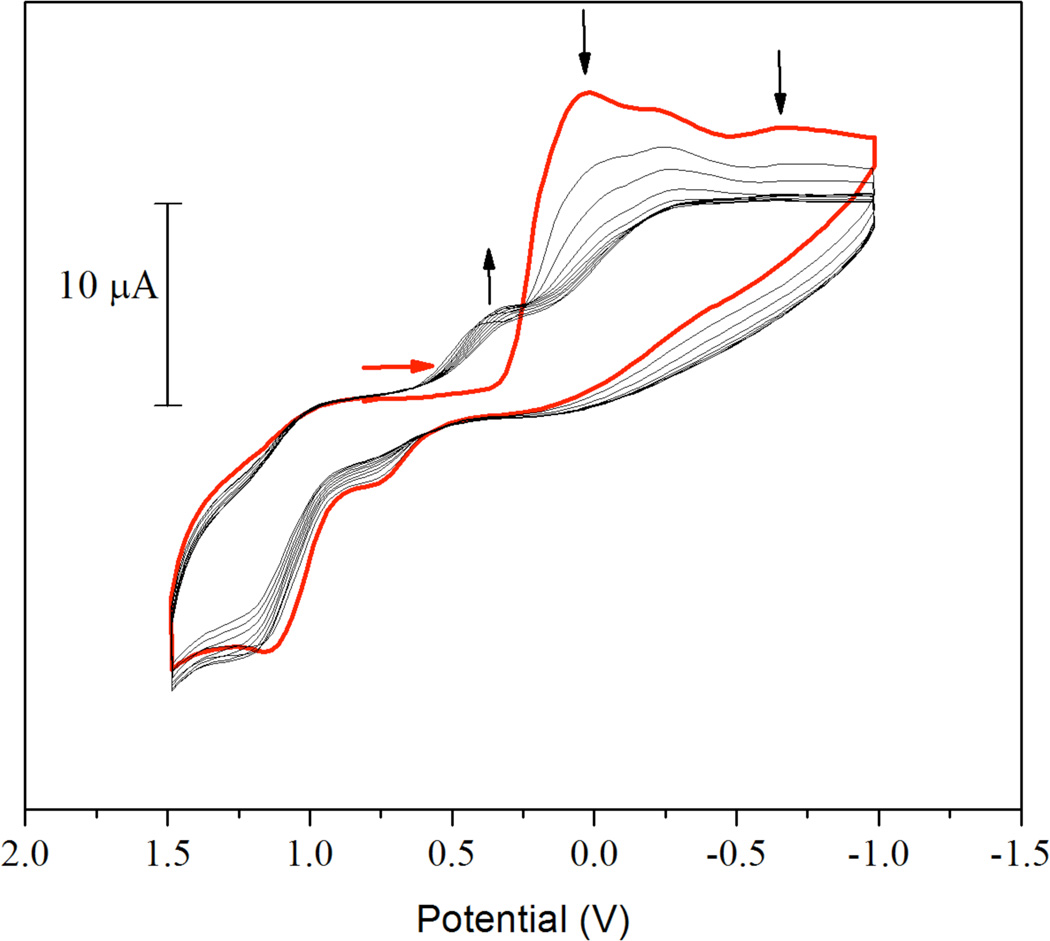
Figure 11.
Cyclic voltammogram of [4](NO3)4 in DMF with 0.1 M (Bu4N)(PF6) as supporting electrolyte. The potential is reported relative to Ag/AgCl and the voltammogram was obtained at a scan rate of 100 mV/s. The red arrow indicates the starting potential and initial scan direction. The bold red trace is the first scan cycle. Following scans are in black. Changes in current as the potential is cycled are indicated by black arrows.

