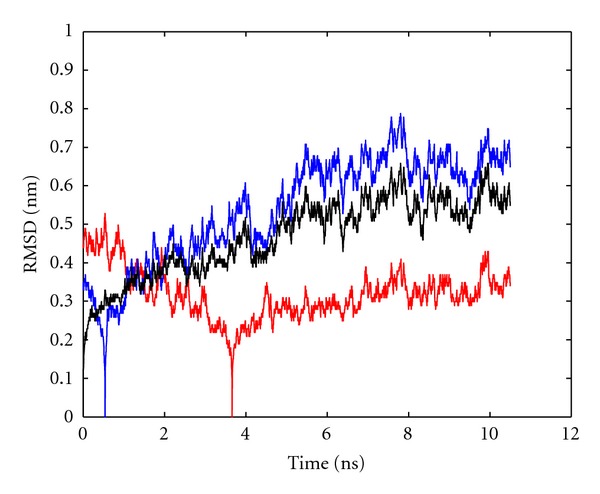
Figure 1.

RMSD as a function of time for trajectory1 (10 ns). Black curve: RMSD between first configuration and all successive ones. Blue curve: for a given configuration (t j), RMSD to each of the other configurations of the same trajectory was computed and averaged, yielding . That value of t j for which is maximum is then adopted as a reference (t 1) to plot RMSD values of the whole trajectory. Red curve: as blue curve, but for minimum . Note that the RMSD between the reference configuration and itself is zero by definition.
