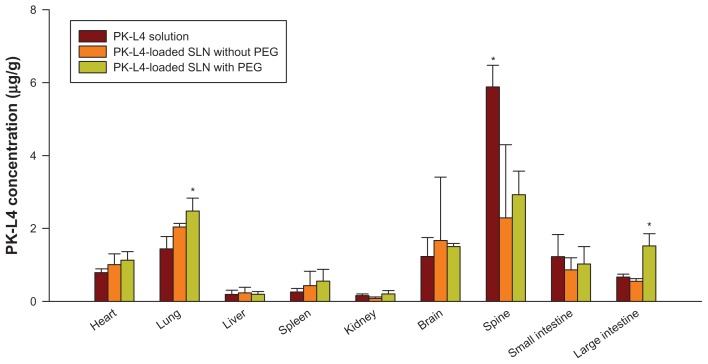
Figure 4.
Tissue distribution of 3-Chloro-4-[(4-methoxyphenyl)amino]furo[2,3-b]quinoline (PK-L4) concentrations from a control PK-L4 solution and one loaded into solid lipid nanoparticles (SLNs) with or without polyethylene glycol (PEG) after intravenous administration to Wistar rats at a dose of 4.7 mg/kg for 30 minutes.
Notes: Each value represents the mean and SD (n = 3). *P < 0.05 as compared with the data of the PK-L4 control solution.

