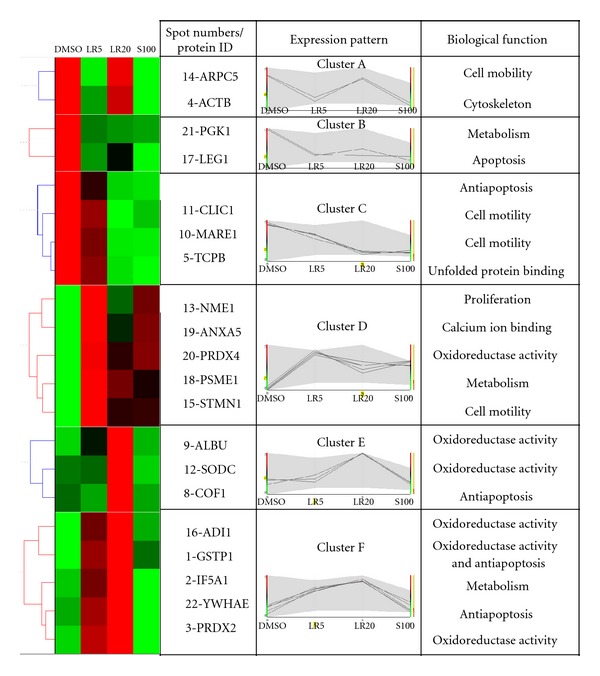
Figure 3.

Hierarchical clustering and functional classification of protein expression induced in fibroblasts by the various drug treatments. The expression patterns of the identified proteins were categorized by UPGMA using Hierarchical Clustering Explorer 3.5 software, and the biological function classification was determined using BGSSJ and the SwissProt protein sequence database. Proteins with similar expression patterns were categorized into six different groups (clusters A, B, C, D, E, and F) in a tree-like diagram. Each row in the color mosaic map indicates one protein with a number matching the 2D-PAGE (Figure 2) and each column represents different groups of proteins identified from the fibroblasts treated with DMSO, LR5, LR20, and S100. A bright red color represents a high protein expression value and a bright green color represents a low protein expression value. Black color indicates that the protein was expressed at an average level. Further information on the differentially expressed protein spots is presented in Table 1.
