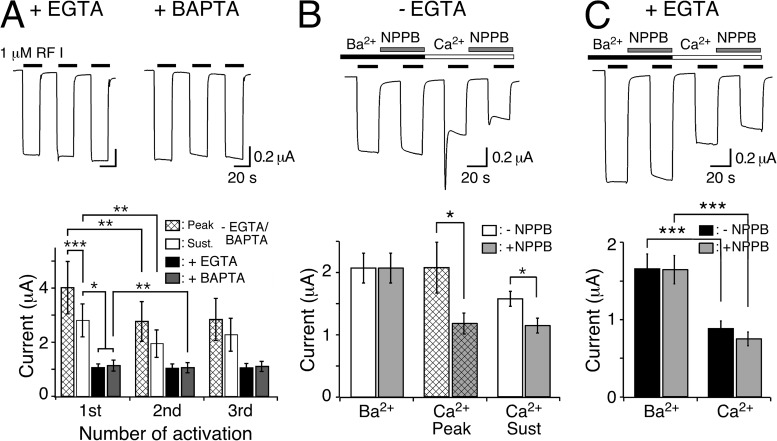
Figure 2.
Chelation of [Ca2+]i abolishes transient peptide-activated currents. (A; top) Representative HyNaC2/3/5 currents in oocytes injected with EGTA or BAPTA. Note the absence of a transient current and the step-like appearance of the currents. (Bottom) Bar graphs comparing the peak (hatched bars) and sustained (open bars) current amplitudes of oocytes expressing HyNaC and of oocytes expressing HyNaC and injected with EGTA (closed bars) or BAPTA (gray bars) (n = 11). (B; top) Representative current trace comparing peptide-activated currents in standard bath and in standard bath in which CaCl2 was replaced by an equimolar amount (1.8 mM) of BaCl2. Currents were measured either in the presence or the absence of 100 µM NPPB. Oocytes were preincubated for 20 s in the corresponding test solutions before activation by 1 µM RFamide I. (Bottom) Bar graph comparing the current amplitudes in the absence of NPPB (open bars) and in the presence of 100 µM NPPB (gray bars) for the indicated conditions. In the presence of Ba2+, no transient current was discernible. The application sequence of the individual solutions was shuffled (n = 8). (C) As in B, for oocytes that had been injected with EGTA. Note the absence of peak currents. (Bottom) Bar graph comparing the current amplitudes in the absence of NPPB (closed bars) and in the presence of 100 µM NPPB (gray bars) for sustained currents. *, P < 0.05; **, P < 0.01; ***, P < 0.001.

