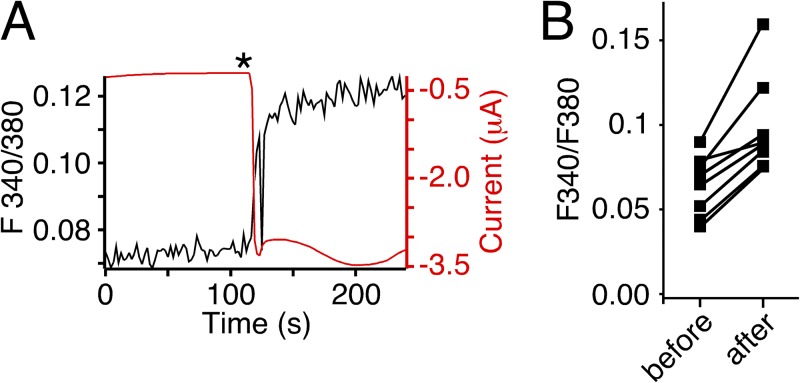
Figure 5.
Activation of HyNaC increases [Ca2+]i in oocytes. (A) Representative trace (black) from photometric Ca2+ measurements illustrating the increase of the F340/380 ratio in a HyNaC2/3/5-expressing oocyte after the application of RFamide I (asterisk). Oocytes had been injected with 50 nl Fura-2AM (1 mM) 30–120 min before the recording. Thus, the increased F340/380 ratio reflects an increase in [Ca2+]i. The red trace represents the current that paralleled the rise in [Ca2+]i. HyNaC was activated by pipetting Hydra-RFamide I into the bath to yield a final concentration of ∼1 µM RFamide I. (B) Changes of the F340/F380 ratio caused by activation of HyNaC for individual measurements (n = 8).

