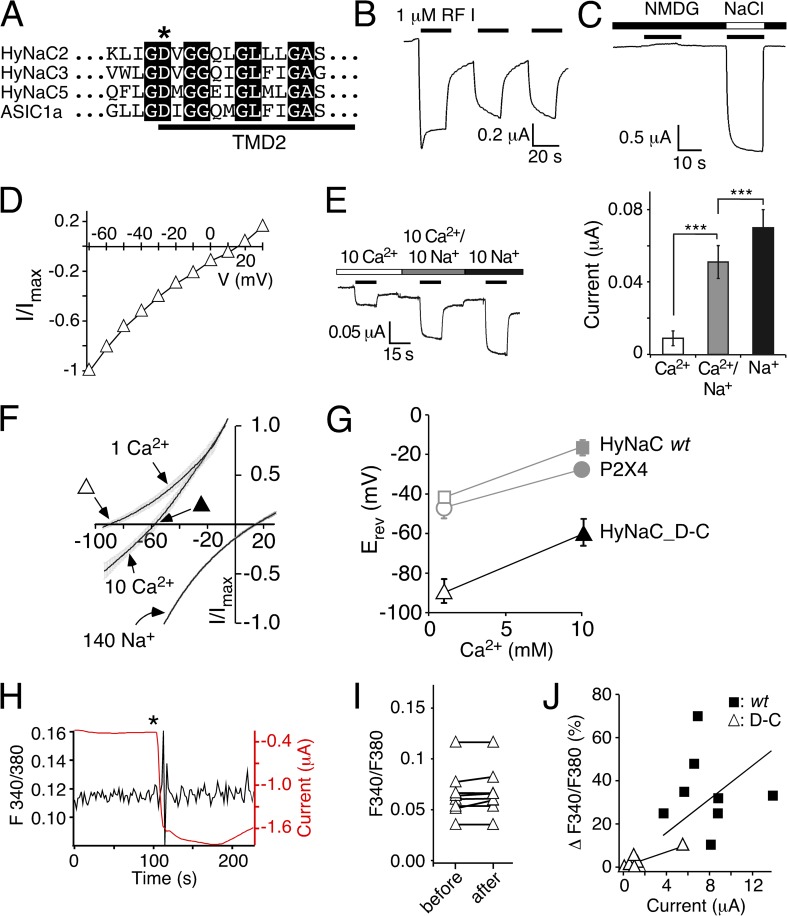
Figure 7.
A conserved aspartate is necessary for the high Ca2+ permeability of HyNaC. (A) Alignment of the amino acid sequences of HyNaC2, 3, and 5 and ASIC1a at the beginning of the second transmembrane domain (TMD2) in the one-letter code. The crucial aspartate is indicated by an asterisk. Completely conserved amino acids are shown as white letters on a black background. (B) Representative current trace for HyNaC_D-C activated by 1 µM RFamide I. The amplitude and shape of the transient current component were more variable than for the wt. Mean maximum current amplitudes were 3.45 ± 1.2 µA for the first activation (n = 5). (C) Representative current trace showing activation of HyNaC_D-C by 1 µM RFamide I in solutions containing 1 mM Ca2+ together with either 140 mM NMDG+ or Na+. No inward current was visible in NMDG+ solutions. (D) I/V plot for HyNaC_D-C activated by 1 µM RFamide I in standard bath solution. Currents were normalized to the current measured at −70 mV, which had an amplitude of −1.1 ± 0.2 µA (n = 6). (E; left) Representative current trace for HyNaC_D-C in solutions containing 10 mM Ca2+, 10 mM Ca2+ and 10 mM Na+, or 10 mM Na+ (nominally free of Ca2+). Conditions were as in Fig. 3 B. (Right) Quantitative comparison of current amplitudes. ***, P < 0.001. (F) I/V relations of HyNaC_D-C in solutions containing 1 or 10 mM CaCl2 and no NaCl (which had been replaced by 140 or 126.5 mM NMDG-Cl, respectively) and in a solution containing 140 mM NaCl and 1 mM CaCl2. Lines are the sum of eight to nine individual measurements. SEM is indicated by gray errors bars. Experimental conditions were as in Fig. 6 A. Triangles represent the Erevs that are plotted in G. (G) Ca2+-dependent shifts of the Erev reveal a significantly lower Ca2+ permeability of HyNaC_D-C compared with HyNaC wt. Erevs of HyNaC wt and P2X4 (gray symbols) are from Fig. 6 B and shown for comparison. (H) Representative trace (black) from photometric Ca2+ measurements illustrating no change of the F340/380 ratio after the application of ∼1 µM RFamide I (asterisk) in a oocyte expressing HyNaC_D-C. The deflections in the F340/380 ratio immediately after the peptide was added are caused by movements of the solution and are unspecific. Oocytes had been injected with 50 nl Fura-2AM (1 mM) 30–120 min before the recording. The red trace represents the current that robustly increased after peptide application. (I) F340/F380 before and after the application of ∼1 µM RFamide I for HyNaC_D-C (n = 8). (J) Plot of the increase of the F340/380 ratio (as percentage) after the application of RFamide I as a function of peptide-activated current amplitudes. Closed squares represent individual measurements for HyNaC wt, and open triangles are for HyNaC_D-C (n = 8). Current amplitudes were smaller for HyNaC_D-C than for HyNaC wt (n = 8; P < 0.001; Fig. 5 B). Solid lines represent linear fits of the fluorescence/current ratio. Note that the slope of this line was larger for wt than for the D-C mutant, indicating a higher relative Ca2+ permeability of the wt.

