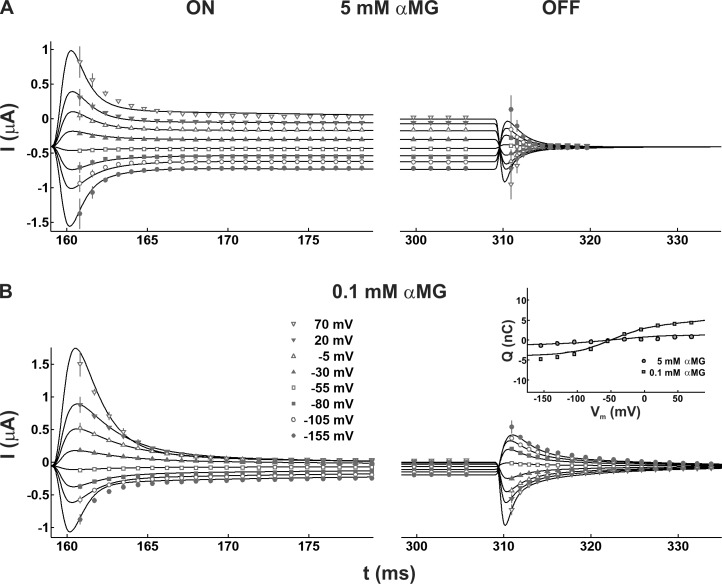
Figure 5.
The simulated steady-state and pre–steady-state ON and OFF currents in the presence of 90 mM [Na+]o and αMG. Simulated currents obtained with (A) 5 mM or (B) 0.1 mM [αMG]o are compared with experimental data. (Inset) Q(Vm) curves obtained from integration of the OFF transient currents in the presence of 90 mM [Na+]o and 5 mM or 0.1 mM [αMG]o.

