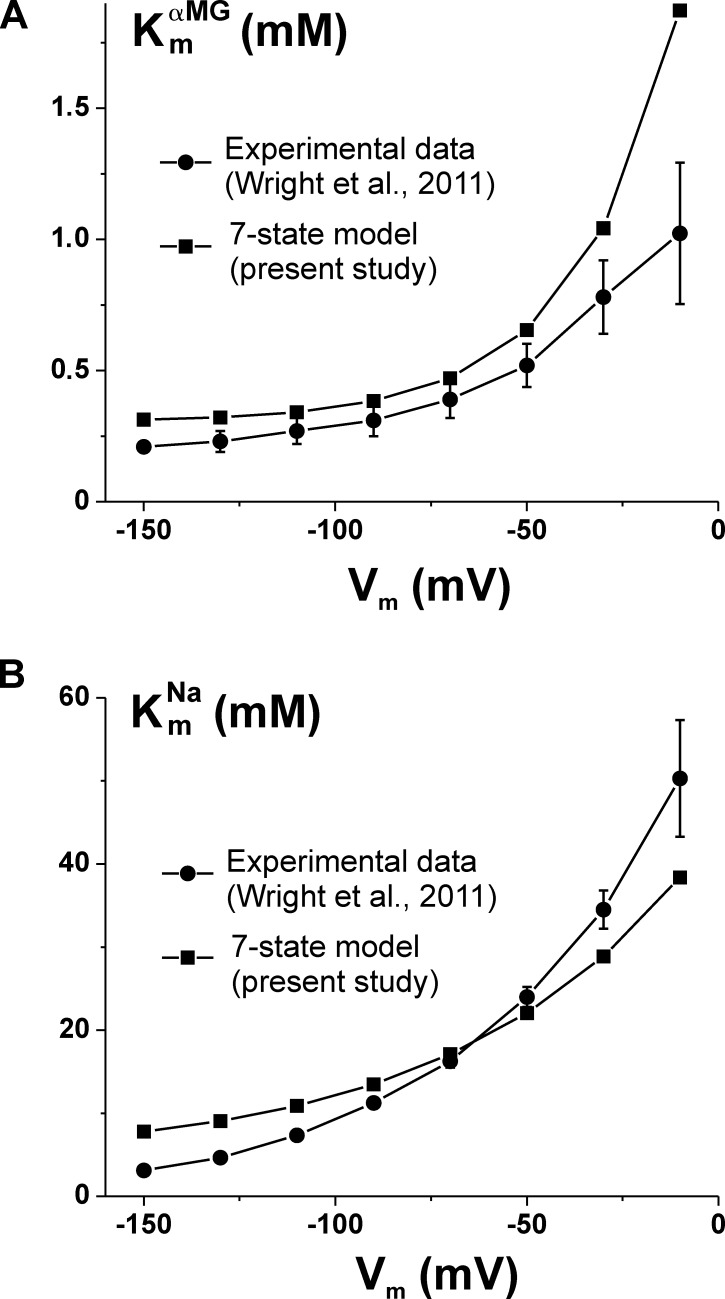
Figure 6.
Comparison of αMG and Na+ affinity constants predicted by the seven-state model with experimental data from a published study. (A) , in the presence of 100 mM [Na+]o, and (B) in the presence of 25 mM [αMG]o, are calculated as a function of membrane potential using the seven-state model and the parameters given in Table 1 (filled squares without error bars). These values are compared with the data published by Wright et al. (2011) for a typical hSGLT1-expressing oocyte (filled circle with error bars representing the fitting uncertainty).

