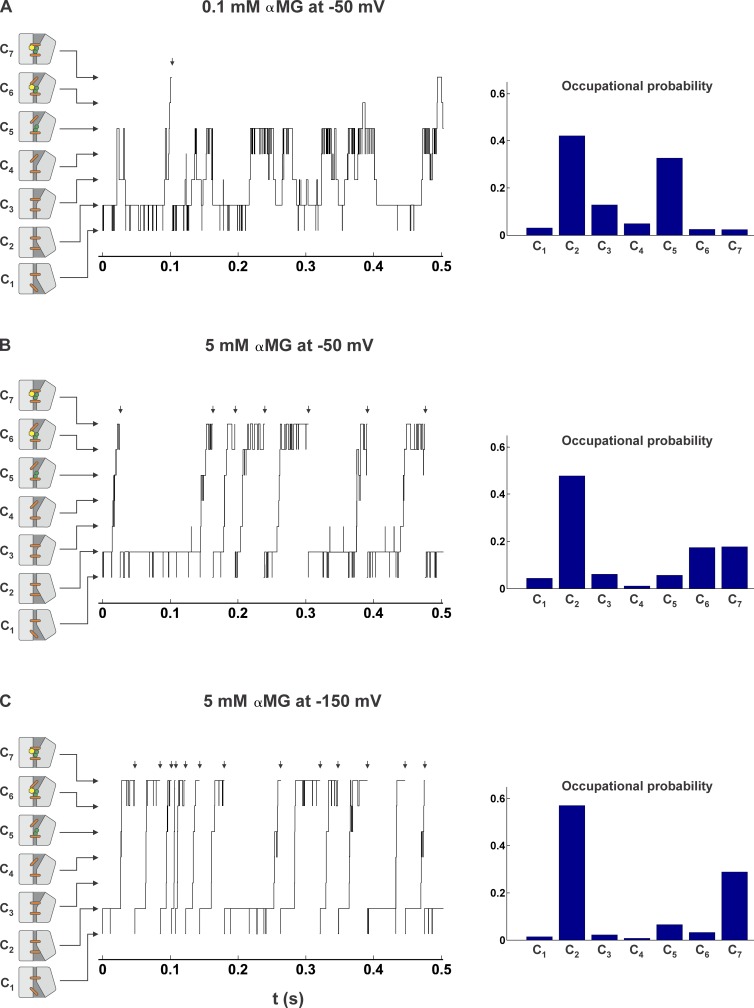
Figure 7.
The conformational time course of SGLT1 in different conditions. The time courses were simulated for 10 s (events occurring during the first 0.5 s are depicted) in the presence of 90 mM [Na+]o and (A) 0.1 mM [αMG]o at −50 mV, (B) 5 mM [αMG]o at −50 mV, and (C) 5 mM [αMG]o at −150 mV. Short arrows above each panel indicate the completion of a cotransport cycle and conformational change from C7 to C1. The occupational probabilities of the seven states during the 10 s period are shown on the right side of each panel. In addition, conformations suggested by the structural data of the LeuT fold family have been assigned to states C1 through C7 to illustrate the behavior of SGLT1. The so-called thin gates are represented by orange sticks, and the green circles and yellow hexagons represent Na+ ions and glucose molecules.

