Figure 1.
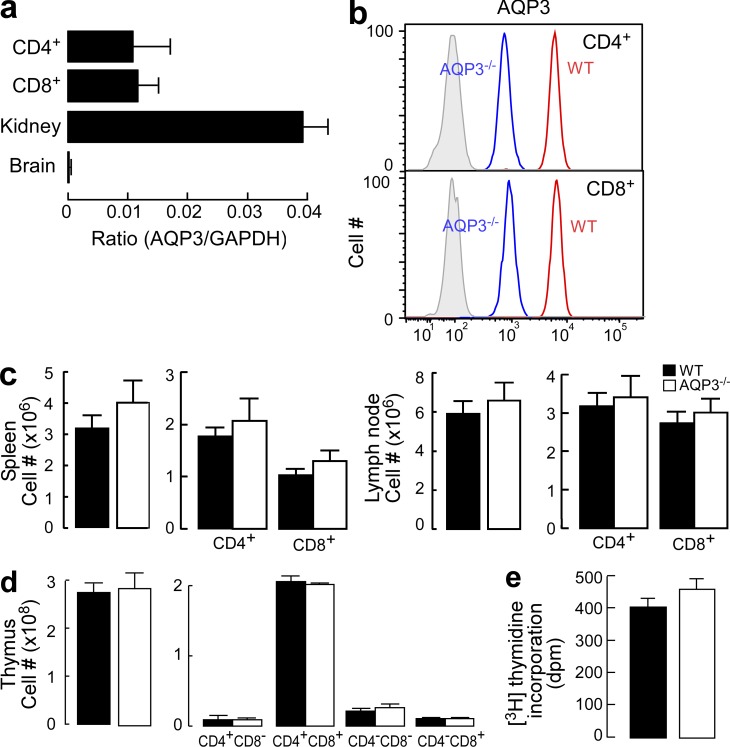
Normal cellularity and subpopulations of T cells in AQP3-null mice. (a) The messenger RNA expression levels of AQP3 in sorted CD4+ and CD8+ T cells as well as in kidney and brain tissues were assessed by real-time PCR (SE; n = 4). Data are expressed as the AQP3/GAPDH ratio. (b) Flow cytometric analysis of AQP3 expression in CD4+ (top) or CD8+ (bottom) T cells from WT and AQP3−/− mice. (c) Cell population analysis in the spleen (left) and LN (right). The numbers of total cells, CD4+ and CD8+ cells from WT and AQP3−/− mice (SE; n = 4), are shown. (d) Cell population analysis in the thymus. The numbers of total cells and indicated subsets (SE; n = 4) are shown. (e) [3H]Thymidine incorporation in CD4+ T cells from WT and AQP3−/− mice (SE; n = 4–5). Each experiment was performed three times.

