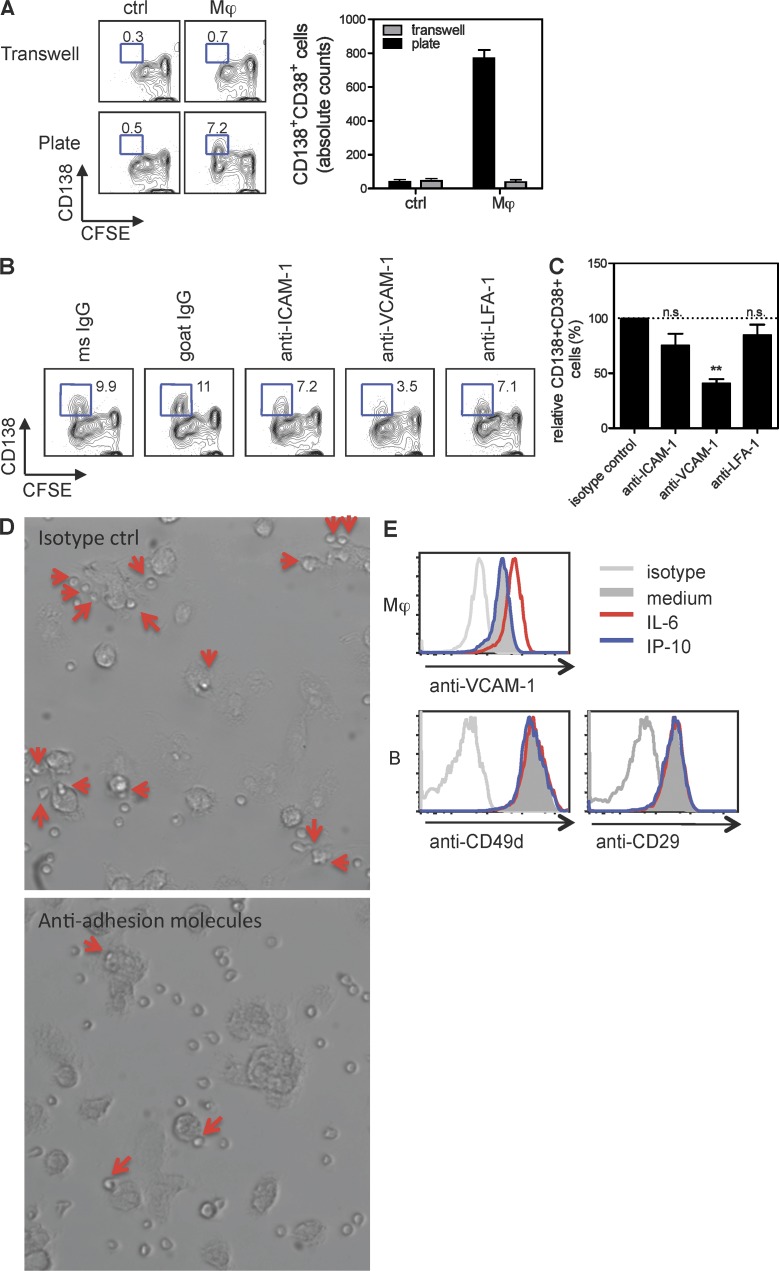
Figure 4.
Mϕ-induced PC differentiation requires cell–cell contact through VCAM-1. (A) Sorted naive B cells were co-cultured with autologous Mϕs or medium for 6 d in 96-well plates or transwells and analyzed for PC phenotype and counts. Mean ± SD of duplicate cultures is shown. (B) Co-culture of naive B cells and Mϕs in the presence of 10 µg/ml anti–ICAM-1, anti–VCAM-1, and anti–LFA-1. (C) Data shown are mean ± SEM of relative PC counts from four independent experiments using cells from different donors. **, P = 0.0007, two-sample paired Student’s t test. (D) Total B cells were co-cultured with autologous Mϕs in the presence of mAb against VCAM-1, LFA-1, and ICAM-1 or isotype controls for 18 h. Images were taken using an Eclipse Ti microscope (Nikon) with a 20× objective. Arrows indicate B cells that are associated with Mϕs. (E, top) Mϕs were stimulated with 50 ng/ml IL-6 or 100 ng/ml IP-10 for 18 h and analyzed for the expression of VCAM-1 by flow cytometry. (bottom) Expression of CD49d and CD29 on B cells activated by IL-6 and IP-10 for 18 h.

