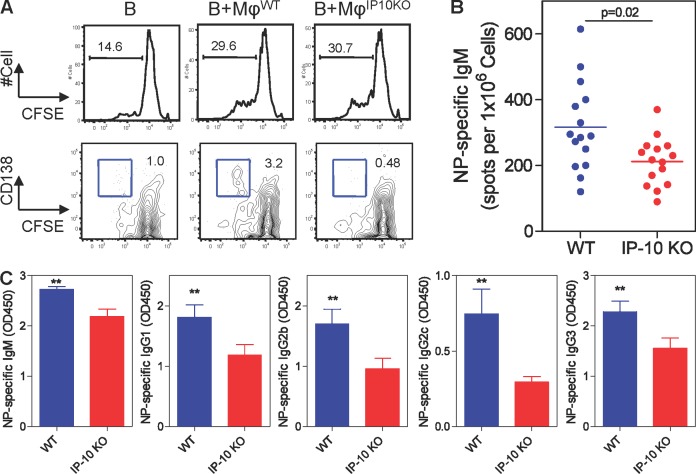
Figure 6.
IP-10 contributes to the induction of Ag-specific Abs in vivo. (A) CFSE-labeled B cells and sorted Mϕs were co-cultured in the presence of 5 µg/ml Fab2′ anti-IgM and 50 nM CpG for 5 d and measured for the expression of CD138. Data are representative of two experiments of a total 6 mice per group. (B) C57BL/6 and IP-10–KO mice were immunized i.p. with 50 µg NP-Ficoll. Spleens were collected 7 d after immunization. Frequency of splenic NP-specific IgM ASCs was measured by ELISPOT. Data represent mean of 15 mice per group polled from three experiments. The p-value was determined by an unpaired Student’s t test. (C) Serum titers of NP-specific IgM, IgG1, IgG2b, IgG2c, and IgG3 were measured by ELISA. Serum was diluted in 1:180 for IgM and 1:60 for other Ig classes. Data represent mean ± SEM of nine mice per group pooled from two experiments. **, P < 0.01, a linear mixed model analysis.

