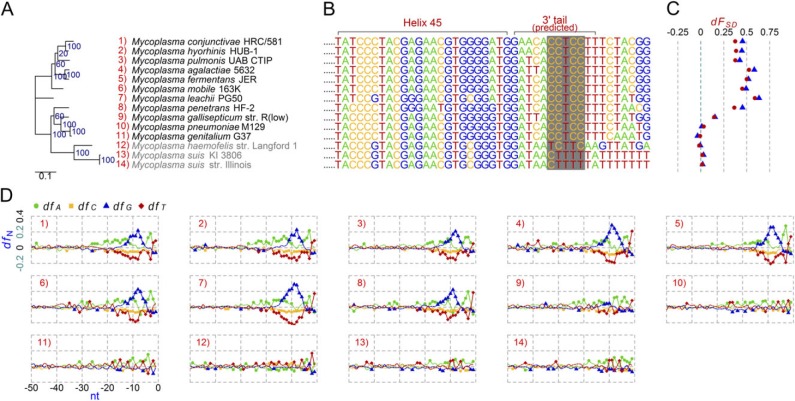
Fig. 4.
Comparative analysis of the anti-SD genomes and the non–anti-SD genomes in the genus Mycoplasma. (A) Maximum likelihood phylogenetic tree. Group 4 non–anti-SD genomes are shown in gray. (B) Predicted 16S rRNA 3′ tail sequences. The regions corresponding to the Escherichia coli anti-SD motif are shaded in gray. (C) SD indexes (dFSD). Triangle: cutoff value < −3.4535 kcal/mol; Dot: cutoff value < −4.4 kcal/mol. (D) Fractions of the four nucleotides (dfA, dfC, dfG, and dfT) at specific positions between −50 and −1 nt from all protein-coding genes in each genome. The background fraction was subtracted. For details, see Materials and Methods.

