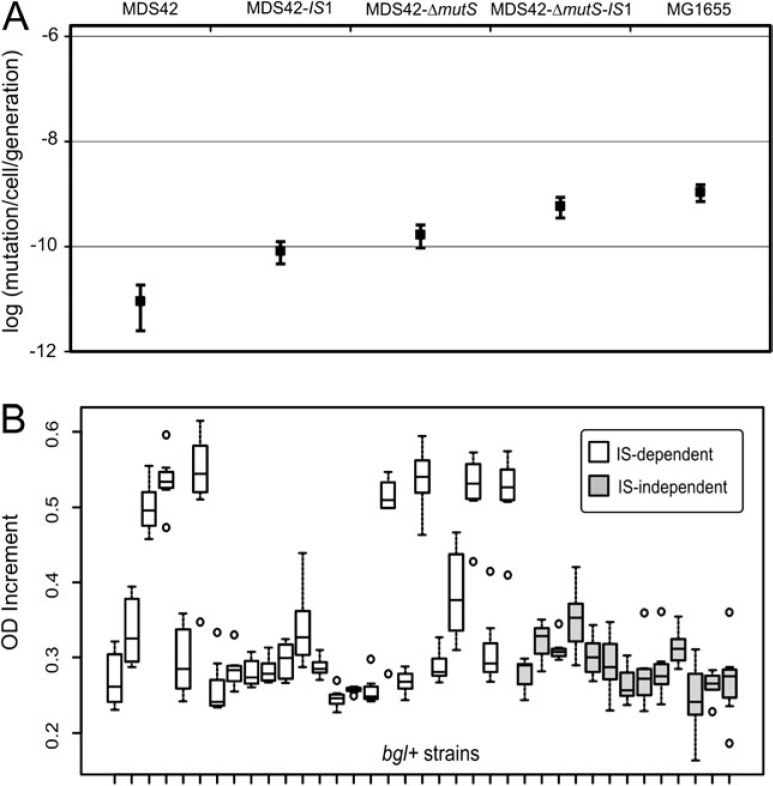
FIG. 4.
Mutation rate and fitness measurements. (A) The figure shows mutation rates calculated from the numbers of colonies growing on salicin-minimal plates using fluctuation analyses. Bars indicate 95% confidence intervals. (B) Fitness of salicin-exploiting genotypes. We compared the growth characteristics of 37 strains where growth data were available and OD increment showed a coefficient of variation less than 0.2. Horizontal lines of the boxplots correspond to the medians, the bottoms and tops of the boxes show the 25th and 75th percentiles, respectively. Whiskers show either the maximum (minimum) value or 1.5 times the interquartile range of the data, whichever is smaller (higher). Points more than 1.5 times the interquartile range above the third quartile or below the first quartile are plotted individually as outliers. Difference of bgl+ IS-mutants compared with point mutants was highly significant (Wilcoxon rank-sum test, P < 10−4).

