
Fig. 1.
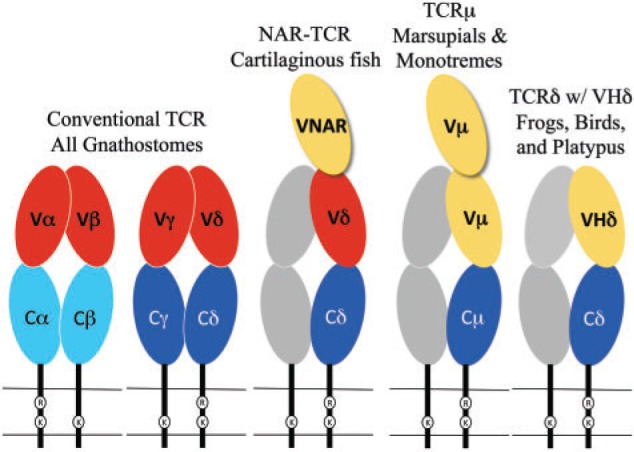
Cartoon diagram of the TCR forms found in different species. Oblong circles indicate Ig super-family domains and are color coded as C domains (blue), conventional TCR V domains (red), and VHδ or Vµ (yellow). The gray shaded chains represent the hypothetical partner chain for TCRµ and TCRδ using VHδ.