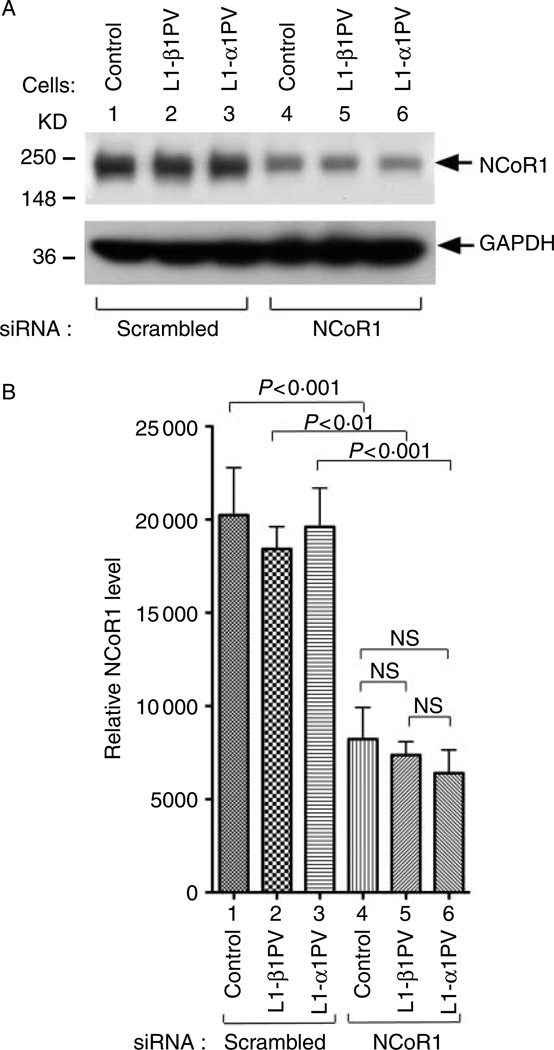
Figure 2.
Abundance of NCoR1 protein in control cells, L1-β1PV cells, and L1-α1PV cells after transduction with scrambled-siRNA or NCoR1-siRNA lentiviruses. (A) Representative results of western blot analysis. Cellular extracts were prepared and western blot analysis was carried out using anti-NCoR1 #1975/1976 antibody (upper panel) and anti-GAPDH antibody (lower panel) as loading control. The experiments were performed with three replicates for each cell line. (B) Quantitative analysis for the relative abundance of NCoR1 protein. NCoR1 protein levels were normalized against the GAPDH protein level. The P values are indicated. NS, not significant.

