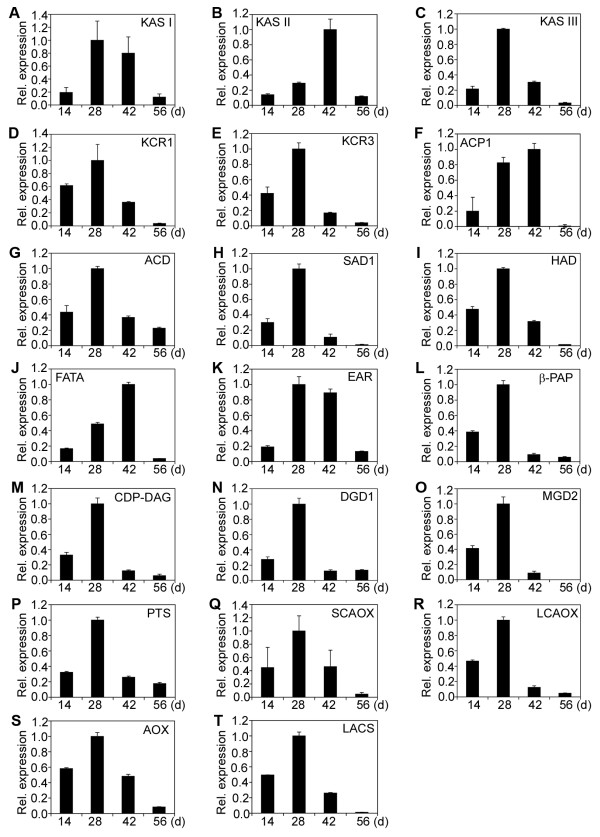
Figure 2.
Relative expression of fatty acid and lipid biosynthetic genes (I). (A) Ketoacyl ACP synthase I (KAS I). (B) Ketoacyl ACP synthase II (KAS II). (C) Ketoacyl ACP synthase III (KAS III). (D) 3-ketoacyl-CoA reductase 1 (KCR1). (E) 3-ketoacyl-CoA reductase 3 (KCR3). (F) Plastial isoform of acyl carrier protein 1 (ACP1). (G) Acyl-CoA dehydrogenase (ACD). (H) Semialdehyde decarboxylase 1 (SAD1). (I) Hydroxyacyl-ACP dehydratase (HAD). (J) Acyl-ACP thioesterase (FATA). (K) Enoyl-ACP reductase (EAR). (L) Phosphatidic acid phosphatase β (β-PAP). (M) CDP-diacylglycerol synthase (CDP-DAG). (N) Digalactosyldiacylglycerol synthase 1 (DGD1). (O) Monogalactosyldiacylglycerol synthase 2 (MGD2). (P) Phosphatidylinositol synthase (PTS). (Q) Short-chain acyl-CoA oxidase (SCAOX). (R) Long-chain acyl-CoA oxidase (LCAOX). (S) Acyl-CoA oxidase (AOX). (T) Long-chain acyl-CoA synthase (LACS). The gene transcripts were measured by qRT-PCR. Results are shown as the relative expression of genes at different developmental stages by comparing to itself at the highest expression, which was set as “1”. The experiments were performed in triplicate and the data are presented as means ± SD.

