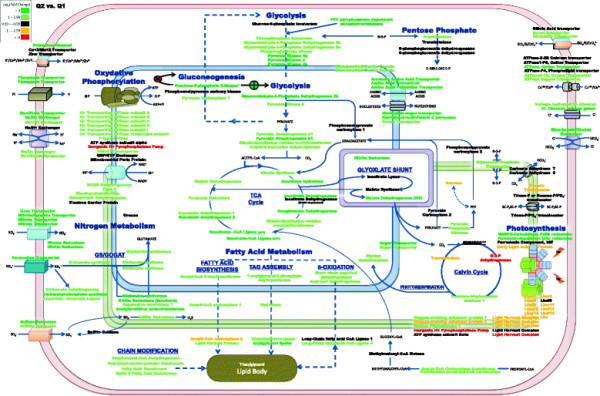
Figure 4.

Proposed cellular metabolic map forP. tricornutumduring nutrient depletion and initial lipid accumulation as compared to nutrient replete conditions (Q2 vs. Q1). Differences in fold change are based on log2 scale. Color scale represents up-expressed (green) and down-expressed (red) genes. Genes are represented within organelles based on predicted protein localizations (from the literature) including probable membrane bound proteins.
