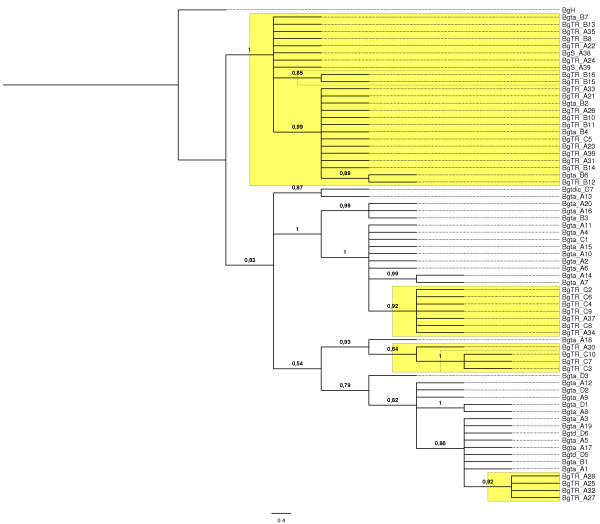
Figure 2.
Phylogeny inferred by Bayesian analysis from the combined tub2 and EF1α sequence loci. The 50% majority rule consensus tree is shown. Maximum likelihood analysis recovered the same topology. The numbers below branches are Bayesian posterior probabilities. Branch lengths are proportional to the number of steps (character changes) along the branch. Labels on the phylogeny are isolates collected from different hosts at different locations: BgTR triticale, Bgta wheat, Bgtd durum wheat, Bgtdic wild emmer wheat, BgS rye, BgH Barley; A Belgium, B France, C Poland and D Israel. Yellow shaded areas represent isolates pathogenic on triticale.

