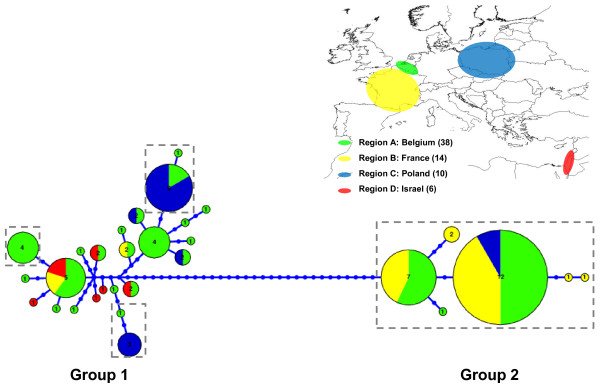
Figure 3.
Multilocus haplotype network from the 50% majority rule consensus tree inferred by Bayesian analysis. The network was performed in the program Haploviewer. The B.g. f.sp. hordei haplotype inferred from GenBank was excluded out of this analysis because of its large mutational distance with the isolates from this study. The circle area of each haplotype, coded as a number, is proportional to its frequency. Dots represent inferred unsampled or extinct haplotypes. Haplotypes framed with a dotted line represent isolates pathogenic on triticale.

