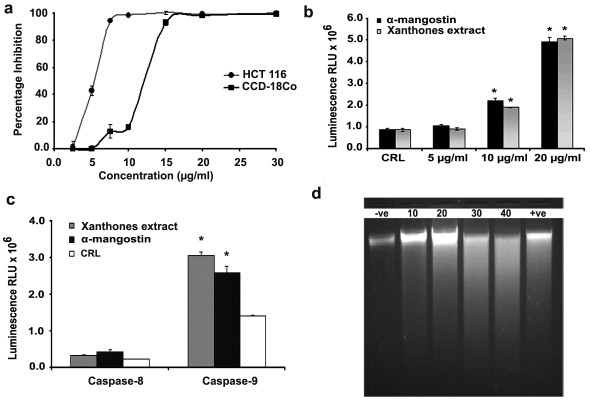
Figure 2 .
Cytotoxic and apoptotic effects of α-mangostin and the xanthones extract on HCT 116 cells. Dose response curves of the xanthones extract on HCT 116 and CCD-18Co cells in the concentration range 2.5 – 30 μg/ml (a). Effect on caspases-3/7 (b), and caspases-8 and −9 (c). Effect on DNA fragmentation (d): the negative control was 0.5% DMSO, the positive control was α-mangostin at 20 μg/ml, and the xanthones extract was applied at 10, 20, 30 and 40 μg/ml. (*) indicates P < 0.05.

