
Fig. 5.
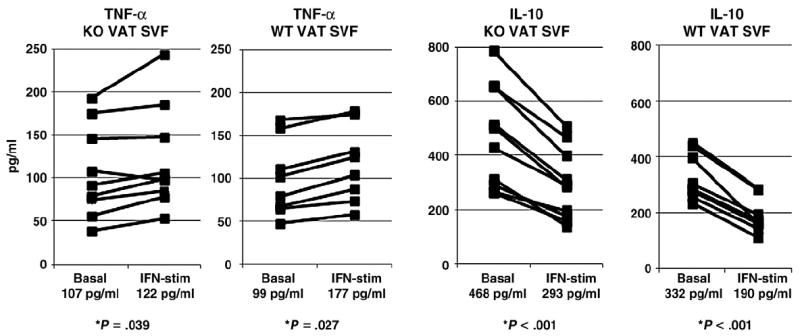
In vitro SVF cytokine expression responses in KO mice: ELISA of supernatants from VAT SVF cultured in media +/− recombinant IFN-γ for 24 h. Mean cytokine levels for each condition (basal and IFN-γ-stimulated) within each group (obese KO and obese WT) are reported under abscissa labels. Ordinates are pg/mL; note different ordinate scales. P values displayed are derived from comparison of basal and IFN-γ-stimulated arms for each cytokine within each animal cohort (obese KO and obese WT) using paired t test. No differences were observed inmean basal and IFN-γ-stimulated TNF-α levels in SVF between obese KO and obese WT, but IL-10 levels were significantly increased in both basal and IFN-γ-stimulated conditions in SVF from obese KO mice compared to SVF from obese WT mice (P<.050 in both cases, P value not shown in figure). n=8 obese WT, n=9 obese KO animals.