
Figure 1.
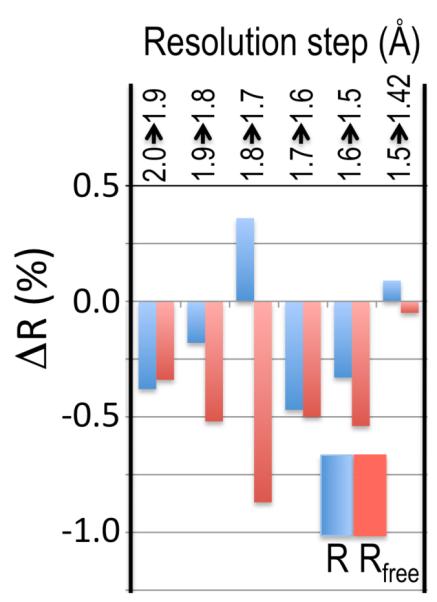
Higher resolution data, even if weak, improves refinement behaviour. For each incremental step of resolution from X->Y (top legend), the pair of bars gives the changes in overall Rwork (blue) and Rfree (red) for the model refined at resolution Y with respect to those for the model refined at resolution X, with both R values calculated at resolution X. The first pair of bars shows that Rwork and Rfree dropped 0.38 and 0.34% upon isotropic refinement, respectively, when the refinement resolution limit was extended from 2.0 to 1.9 Å; the other pairs of bars show the improvement upon anisotropic refinement.