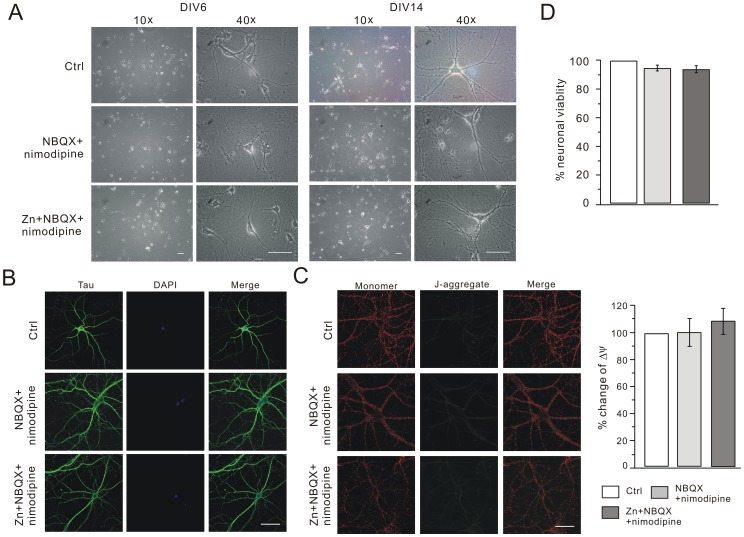
Figure 2. NBQX+nimodipine prevent cell death in chronic zinc exposure.
(A) Typical 10× and 40× bright field pictures of hippocampal neurons of control, NBQX+nimodipine and Zn+NBQX+nimodipine groups at DIV6 and DIV 14. Scale bar, 50 µm. (B) Hippocampal cells were immunostained with tau (green) and DAPI (blue) in control, NBQX+nimodipine and Zn+NBQX+nimodipine groups at DIV14. Merge is the superimposition of Tau and DAPI signals. Note that there was no difference in the dendritic branching and nucleus morphology among three groups. Scale bar, 50 µm. (C) Mitochondrial function was measured in control, NBQX+nimodipine and Zn+NBQX+nimodipine groups. The red and green signals represent the JC-1 monomer (monomer) and JC-1 J-aggregate (J-aggregate), respectively. Merge is the superimposition of red and green signals. Scale bar, 50 µm. The quantification is shown in the right. The mitochondrial membrane potential (Δψ) of cultured cells in each group was calculated as the fluorescence ratio of red to green. Y axis represents the percent change of Δψ in NBQX+nimodipine (99.4±9.9%; n = 9) and Zn+NBQX+nimodipine (107.9±9.6%; n = 10) compared to control. (D) MTT assay derived from cells in control, NBQX+nimodipine and Zn+NBQX+nimodipine groups at DIV14. The ratios (NBQX+nimodipine and Zn+NBQX+nimodipine) were calculated by normalization to control (N = 3).

