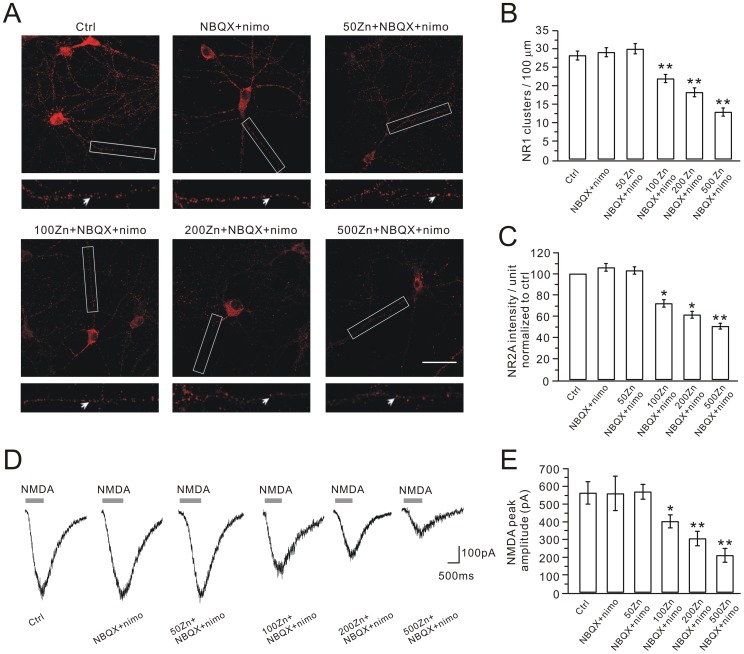
Figure 4. Dose response of zinc effect.
(A) Representative images of NR1 clustering in control, NBQX+nimodipine (nimo) and different concentrations (50, 100, 200 and 500 nM) of zinc plus NBQX+nimodipine. For each image, a higher magnification shows the dendritic segment (enclosed in white box) studded with numerous clusters, indexed by white arrows. Scale bar, 50 µm. (B) and (C) show quantifications of NR1 stainings in (A). (D) Representative whole-cell NMDA currents in cultured cells from control, NBQX+nimodipine and different concentrations (50, 100, 200 and 500 nM) of zinc plus NBQX+nimodipine groups. (E) Bar graphs show the average peak amplitudes, which were 563.2±61.3 pA (control, n = 10), 559.6±94.8 pA (NBQX+nimodipine, n = 10), 569.7±40.1 pA (50 nM Zn+NBQX+nimodipine, n = 10), 402.5±35.3 pA (100 nM Zn+NBQX+nimodipine, n = 11), 305.3±39.4 pA (200 nM Zn+NBQX+nimodipine, n = 10) and 210.4±37.4 pA (500 nM Zn+NBQX+nimodipine, n = 10). *, P<0.05; **, P<0.01 compared to control.

