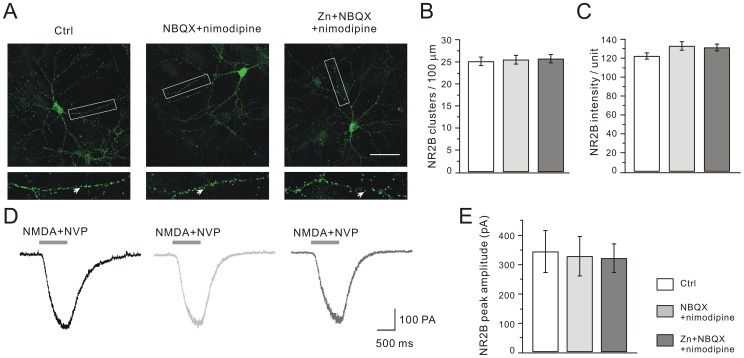
Figure 6. Zinc does not affect NR2B distribution and current.
(A) Representative images of clustering of NR2B in control, NBQX+nimodipine and Zn+NBQX+nimodipine groups. Higher magnification views are shown of the dendritic branches studded with numerous clusters enclosed in white boxes. Scale bar, 50 µm. (B) and (C) show the quantification of (A). The numbers of NR2B clusters were 25.1±1.0 (control, n = 37), 25.5±1.0 (NBQX+nimodipine, n = 36), and 25.7±1.0 (Zn+NBQX+nimodipine, n = 37) per 100 µm dendrite length. The mean intensity of NR2B clusters was 122.4±3.3 (control, n = 25), 133.0±4.5 (NBQX+nimodipine, n = 25) and 131.3±3.6 (Zn+NBQX+nimodipine, n = 23). (D) Representative NR2B currents in response to co-application with the agonist plus NVP-AAM077. (E) Statistics of NR2B currents. Averaged peak currents were 342.7±71.7 pA (control, n = 38), 327.0±67.3 pA (NBQX+nimodipine, n = 20) and 320.0±48.5 pA (Zn+NBQX+nimodipine, n = 20).

