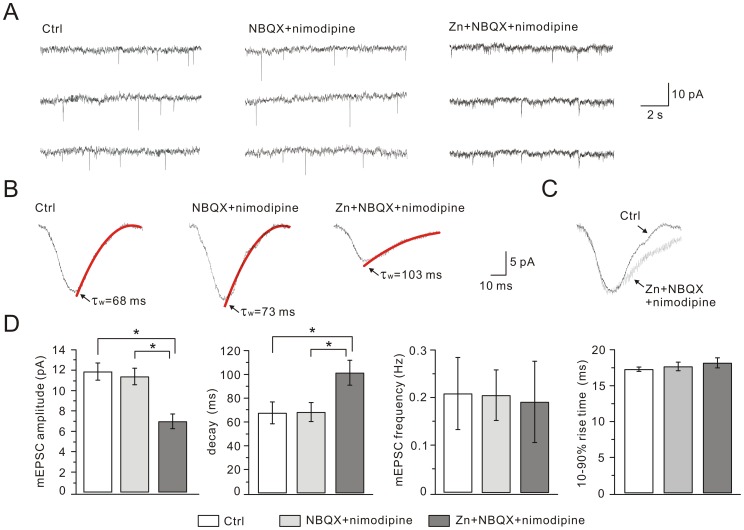
Figure 7. Zinc treatment inhibits NMDA mEPSCs.
(A) Representative NMDA mEPSCs recorded from control, NBQX+nimodipine and Zn+NBQX+nimodipine groups in extracellular medium containing TTX, bicuculline, and NBQX in the absence of Mg2+. (B) Averaged NMDA mEPSCs with superimposed double exponential fitting of the decay phase and indication of the resulting weighted time constant (τw, red traces). (C) NMDA mEPSCs of control shown in black and Zn+NBQX+nimodipine in grey. For comparison, grey trace was normalized to black trace according to the peak. (D) Summaries of peak amplitude, frequency, τw and 10–90% rise-time of NMDA mEPSCs recorded from control, NBQX+nimodipine and Zn+NBQX+nimodipine groups. The averaged amplitudes of NMDA mEPSCs were 11.9±0.8 pA (control), 11.4±0.8 pA (NBQX+nimodipine) and 7.0±0.7 pA (Zn+NBQX+nimodipine). The averaged frequencies were 0.21±0.08 Hz (control), 0.21±0.05 Hz (NBQX+nimodipine) and 0.19±0.09 Hz (Zn+NBQX+nimodipine). The values of τw were 67.7±9.2 ms (control), 68.4±8.0 ms (NBQX+nimodipine) and 101.5±10.5 ms (Zn+NBQX+nimodipine). The average 10–90% rise-times were 17.3±0.3 ms (control), 17.7±0.6 ms (NBQX+nimodipine) and 18.2±0.7 ms (Zn+NBQX+nimodipine). 13 cells were used for control, 12 for NBQX+nimodipine and 12 for Zn+NBQX+nimodipine. *, P<0.05.

