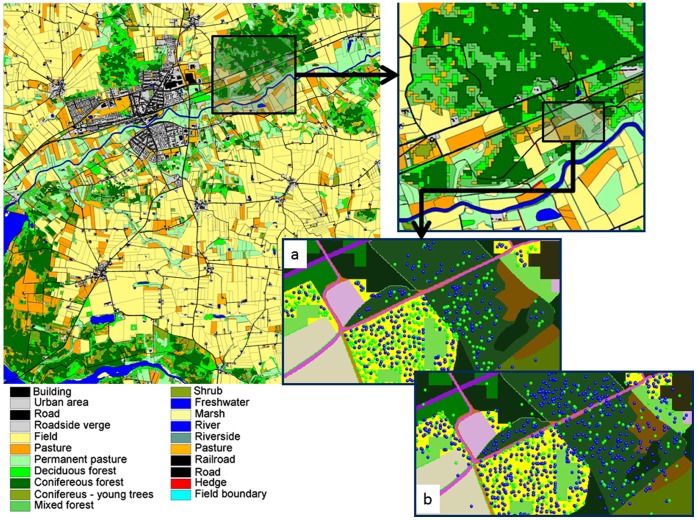
Figure 2. The GIS map of the 10×10 km landscape was used as the landscape for pattern set 2 testing.
Exploded panels show the detail of the map and screenshot of the ALMaSS vole model shows a) male and female locations (blue & green dots) in February, b) June locations. Note some habitats have been recolonized or are occupied by dispersers in June.

