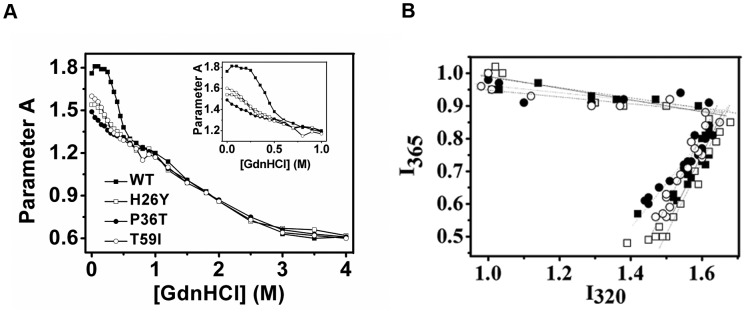
Figure 6. Parameter A and phase diagram analyses of intrinsic fluorescence data.
(A) Parameter A was produced by dividing the fluorescence intensity at 320 nm (I320) by the intensity at 365 nm (I365). (B) In the phase diagram analysis, the fluorescence data were normalized by the I320 and I365 of samples fully denatured in 4 M GdnHCl. The data used was from Fig. 3. Only WT CK (filled square), H26Y (open square), P36T (filled circle) and T59I (open circle) are shown in (B); other mutants are the same as WT CK. Inset are enlargements of Parameter A at low GdnHCl concentrations.

