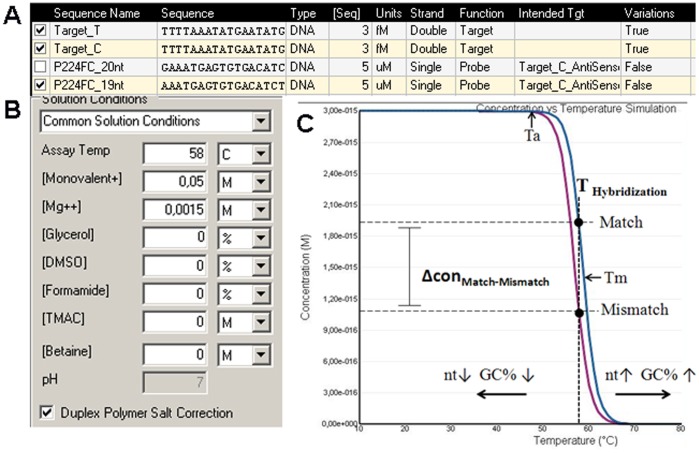
Figure 2. Direct comparison of the thermodynamic stability of match and mismatch using Visual OMP.
The program allows the simulation of the concentration of hybridized matches and mismatches by adding the starting concentration (A) of the target and probe, as well as assay parameter (B) under the solution conditions. (C) Simulation of concentration versus temperature. Schematic representation of the comparison between match and mismatch by concentrations. Ta, optimal annealing temperature for PCR; Tm, melting temperature. Horizontal arrows indicate a switch in the hybridization curve for decreasing (↓) or increasing (↑) probe length (nt) and G/C content (GC%).

