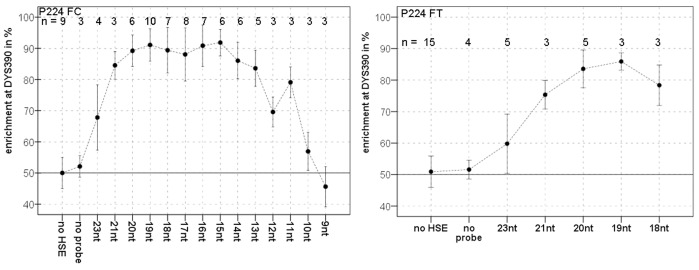
Figure 4. Separation by HSE with different probes.
Enrichment of one contributor from a male DNA mixture is shown in relation to probe length for two different probe sets P224FC/FT (see also File S2). The bars indicate standard deviation of the mean enrichment. No HSE indicates analysis of the male DNA mixture without separation by HSE, and no probe indicates separation of a male DNA mixture by HSE without probe. n = number of extractions.

